Note:
This topic has been translated from a Chinese forum by GPT and might contain errors.
Original topic: 分区表执行计划间歇性走全表
【TiDB Usage Environment】Production Environment
【TiDB Version】7.1.0
【Reproduction Path】
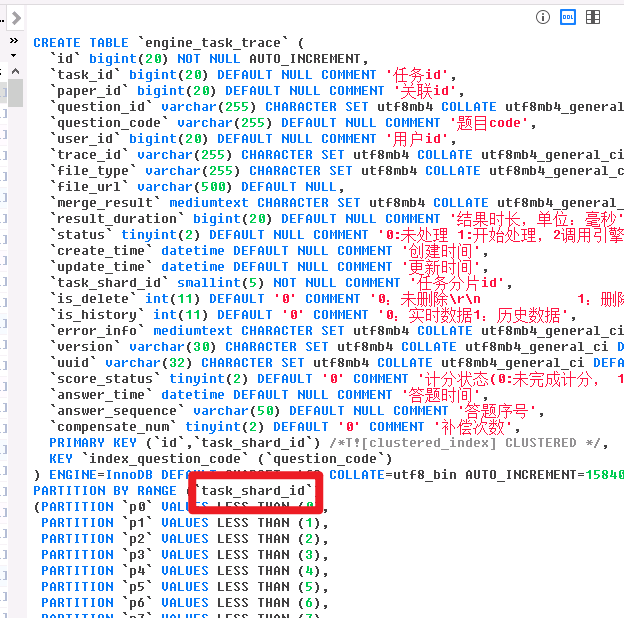
【Encountered Problem: Problem Phenomenon and Impact】Single table with 11,518,584 rows, sometimes queries are extremely slow, and the query execution plan involves a full table scan.
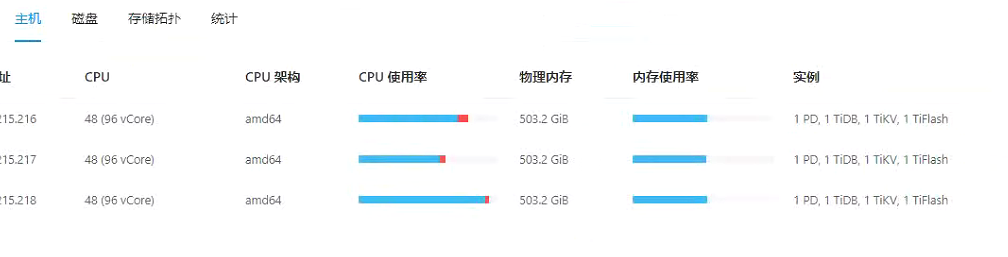
【Resource Configuration】
Server configuration is as follows,
All disks are NVMe-SSD with a single disk of 6T.
【Attachments: Screenshots/Logs/Monitoring】
Partitioned by task_shard_id, 0-100 partitions
But it’s doing a full table scan on a single partition, isn’t that unreasonable?
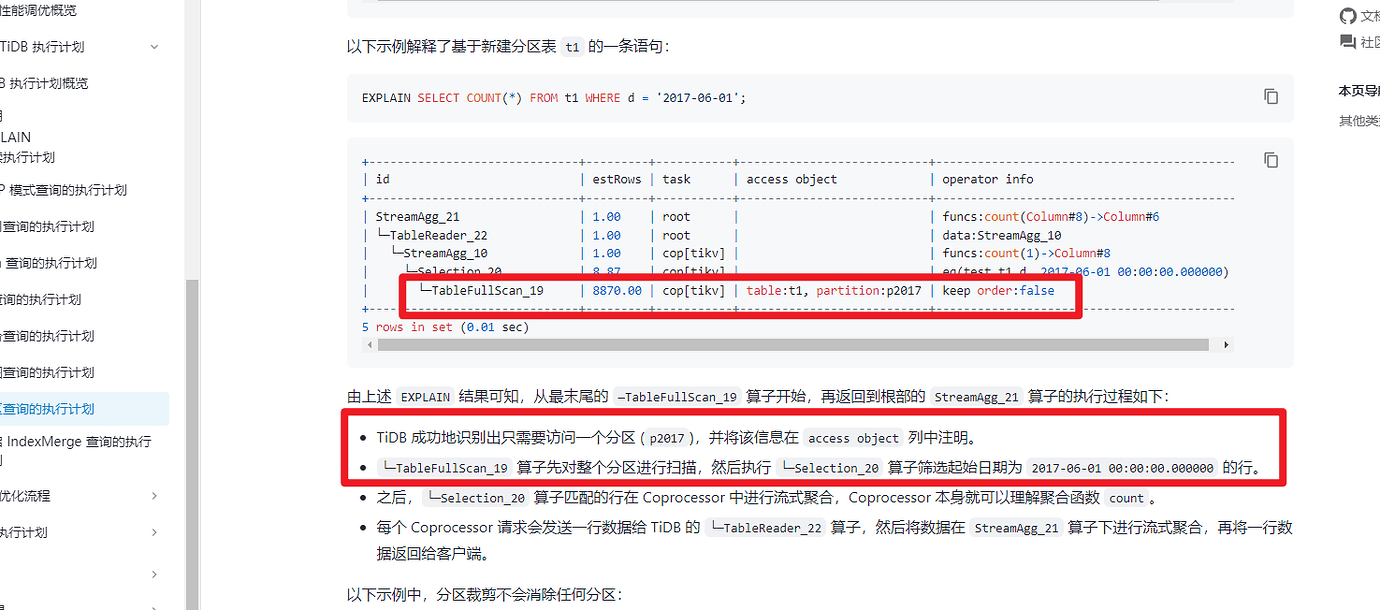
The execution plan for the partitioned table is not quite the same as explained on the official website.
Looking at the execution plan, there is indeed a problem. The WHERE filter was not pushed down to TiKV, but instead, a full table scan was performed and the filtering was done on the TiDB server.
It looks like TiKV has already filtered out 1,882,242 rows of data, which should be the amount of data in one partition, right?
It didn’t push down to the KV nodes, it did a full scan.
Have you enabled the dynamic partition pruning feature?
If it is enabled, it should theoretically prune the partitions correctly and only scan the data that meets the conditions.
It looks like there is a bug. How much data is in the table in total?
Following up, I encountered this problem as well.
It is recommended to start a new thread to ask questions, so you can get more replies 
The TiDB server has statistics information cache, and some of the cache might have issues. Try restarting the TiDB server.
This topic was automatically closed 60 days after the last reply. New replies are no longer allowed.