Note:
This topic has been translated from a Chinese forum by GPT and might contain errors.
Original topic: TIDB-SERVER间歇性OOM
【 TiDB Usage Environment 】Production Environment
【 TiDB Version 】v5.2.1
【 Encountered Issue 】TiDB single node memory keeps increasing, eventually OOM
【 Reproduction Path 】None
【 Issue Phenomenon and Impact 】heap_20220714 (1.2 MB)
TiDB single node memory keeps increasing, periodically OOM
The image you provided is not visible. Please provide the text you need translated.
Are there any mixed deployment components to check for slow queries? Also, what are the settings for tidb_mem_oom_action and tidb_mem_quota_query?
Without mixed components, tidb_mem_oom_action and tidb_mem_quota_query are the default official configurations. There are slow queries, but they are rare.
The default value of tidb_dml_batch_size is 2000. If the batch size of a single DML statement exceeds this value, TiDB will split it into multiple smaller batches for execution.
Check the TiDB logs to see if there are any expensive queries.
Check the logs to see which SQL statements were running when the OOM occurred. TiDB records all of this information. Look at the memory usage of each SQL statement at that time.
The image you uploaded is not visible. Please provide the text you need translated.
I have reviewed the SQL statements with OOM risk, and they are all simple SQLs with low memory usage.
I think you can use the SHOW TABLE REGIONS command to see the distribution of table data across different regions.
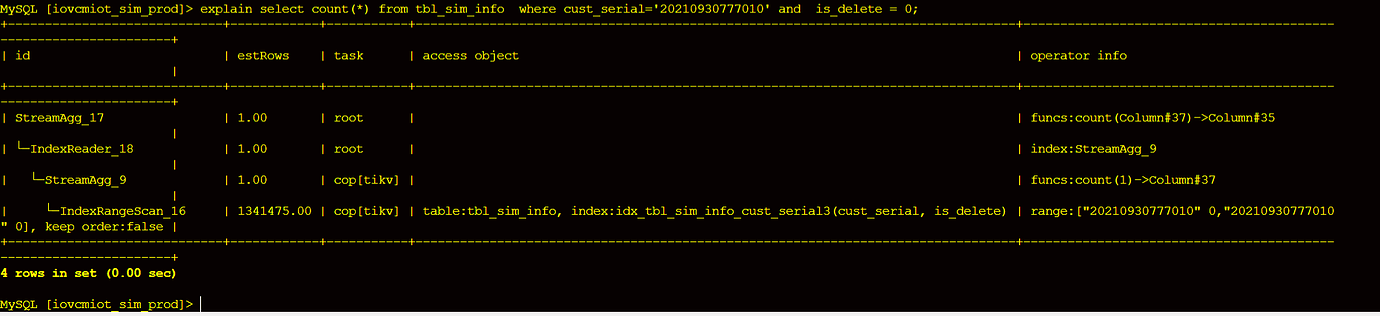
Find the slow query. Please share the execution plan.
The slow query file is over 10 MB, making it difficult to upload. What does this image mean?
Check if the above situation exists.
Troubleshooting reference: TiDB 集群问题导图 | PingCAP 文档中心
[2022/07/14 10:47:21.038 +08:00] [WARN] [expensivequery.go:178] [expensive_query] [cost_time=66.726202067s] [cop_time=284.08799785s] [process_time=224.204s] [wait_time=5.155s] [request_count=97] [total_keys=1352168] [process_keys=1218325] [num_cop_tasks=97] [process_avg_time=2.311381443s] [process_p90_time=6.198s] [process_max_time=7.207s] [process_max_addr=10.70.77.30:20160] [wait_avg_time=0.053144329s] [wait_p90_time=0.18s] [wait_max_time=0.413s] [wait_max_addr=10.70.77.30:20160] [stats=tbl_sim_info:434573453576634369] [conn_id=305183] [user=iovcmiot_sim_prod_user] [database=iovcmiot_sim_prod] [table_ids=“[1365]”] [index_names=“[tbl_sim_info:idx_tbl_sim_info_cust_serial]”] [txn_start_ts=434573613274759169] [mem_max=“18786575 Bytes (17.9 MB)”] [sql="select count(*) from tbl_sim_info where cust_serial=‘20210930777010’ and is_delete = 0 "]

Is the slow_log written very frequently and what is the slow-threshold setting? Are there many slow SQL queries in the cluster?
The slow-threshold value is 300ms. There were some slow SQL queries at that time, but the slow_log file was not large. I don’t know why it would take up so much memory.