Note:
This topic has been translated from a Chinese forum by GPT and might contain errors.Original topic: tidb数据库间歇出现写入性能问题
[TiDB Usage Environment] Production Environment
[TiDB Version] 8.1
[Reproduction Path] What operations were performed when the problem occurred
The issue occurs intermittently every day and has not been resolved yet.
[Encountered Problem: Problem Phenomenon and Impact]
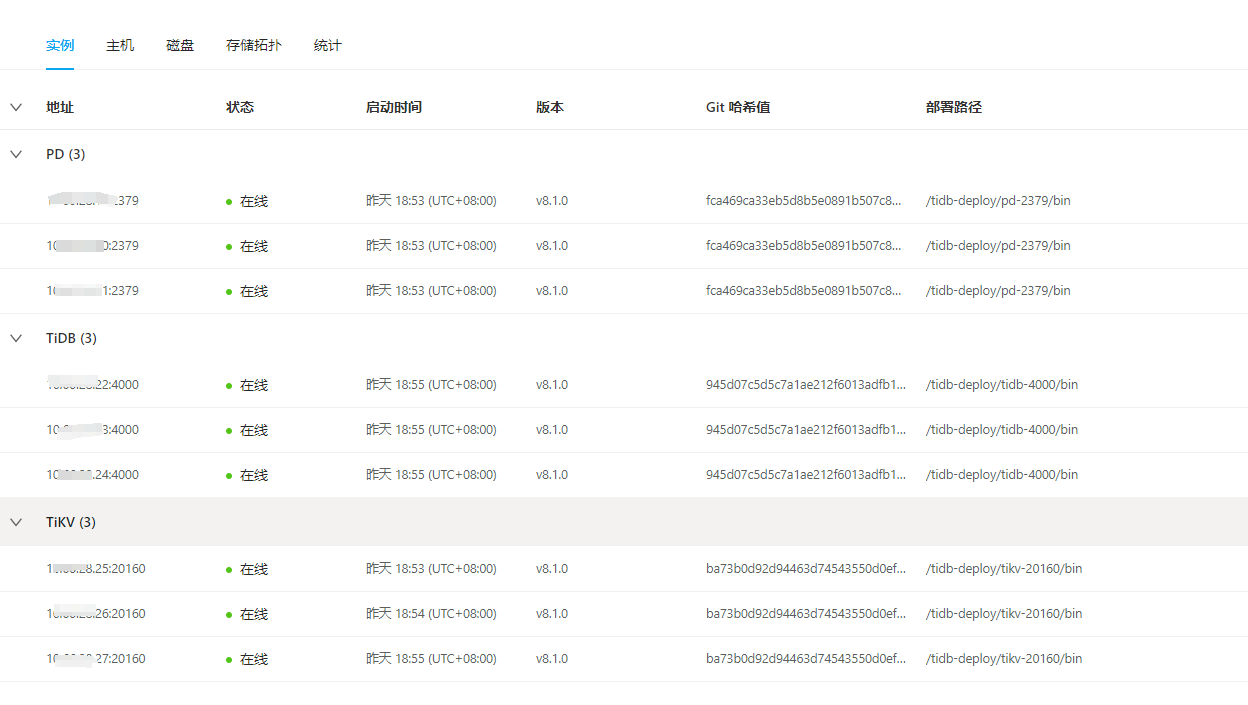
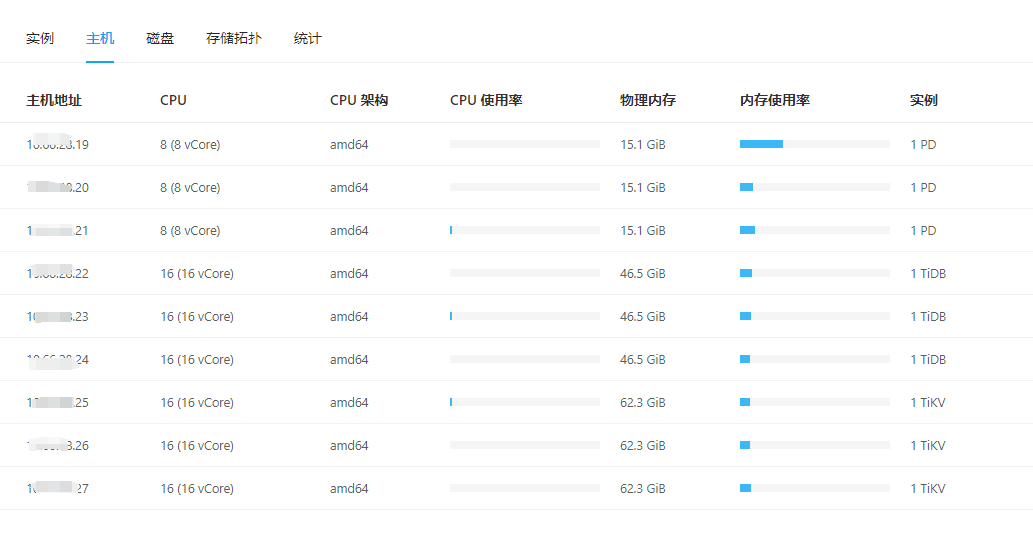
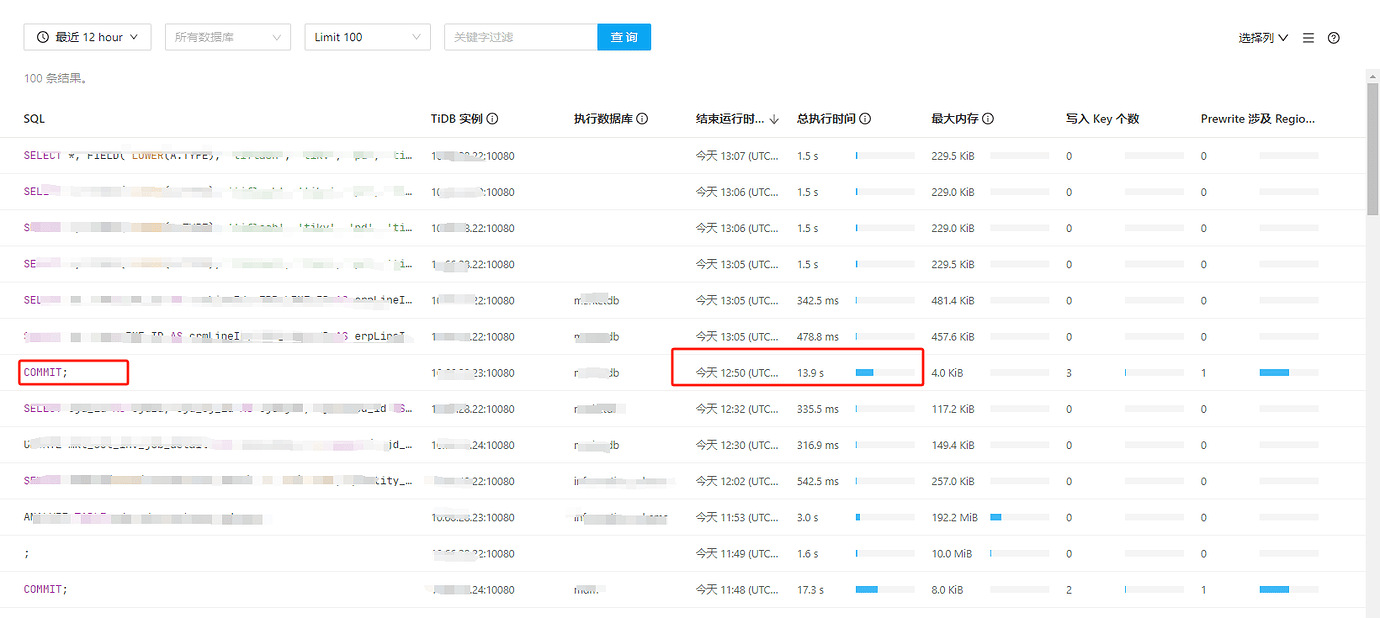
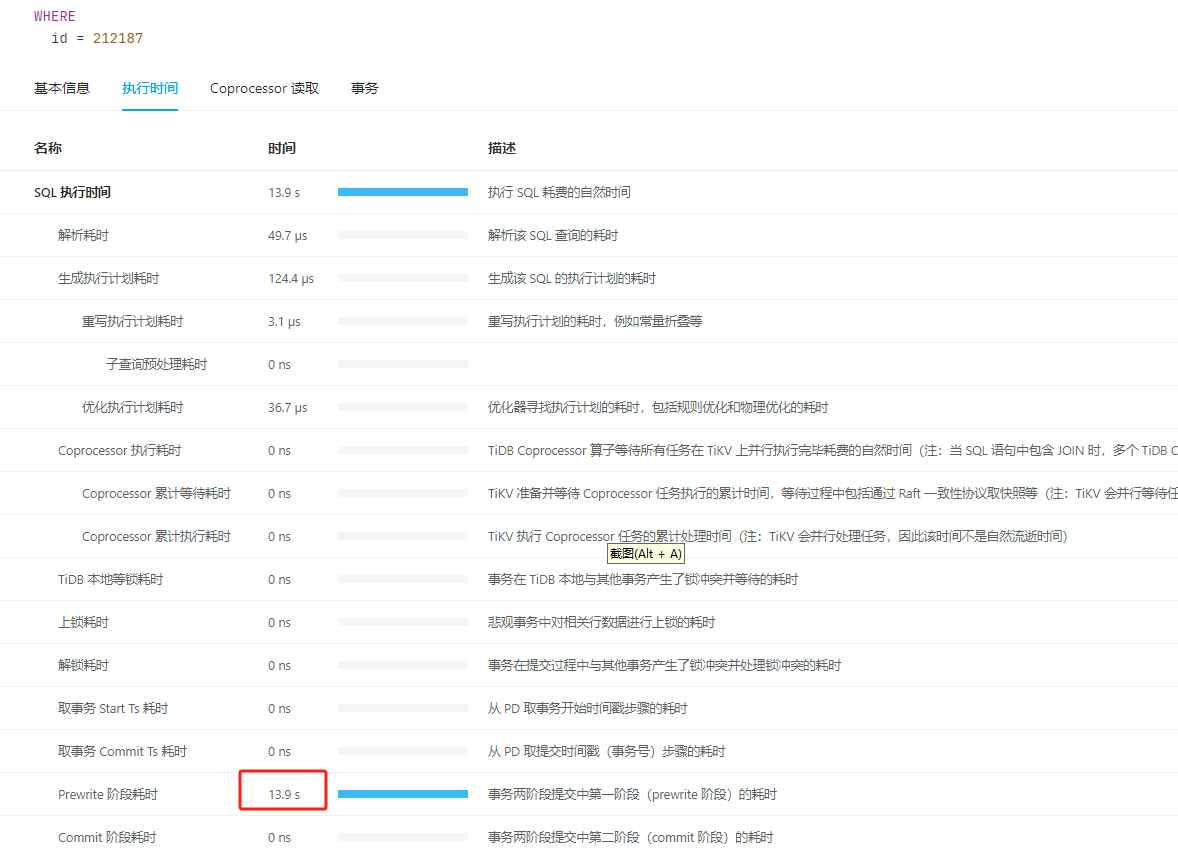
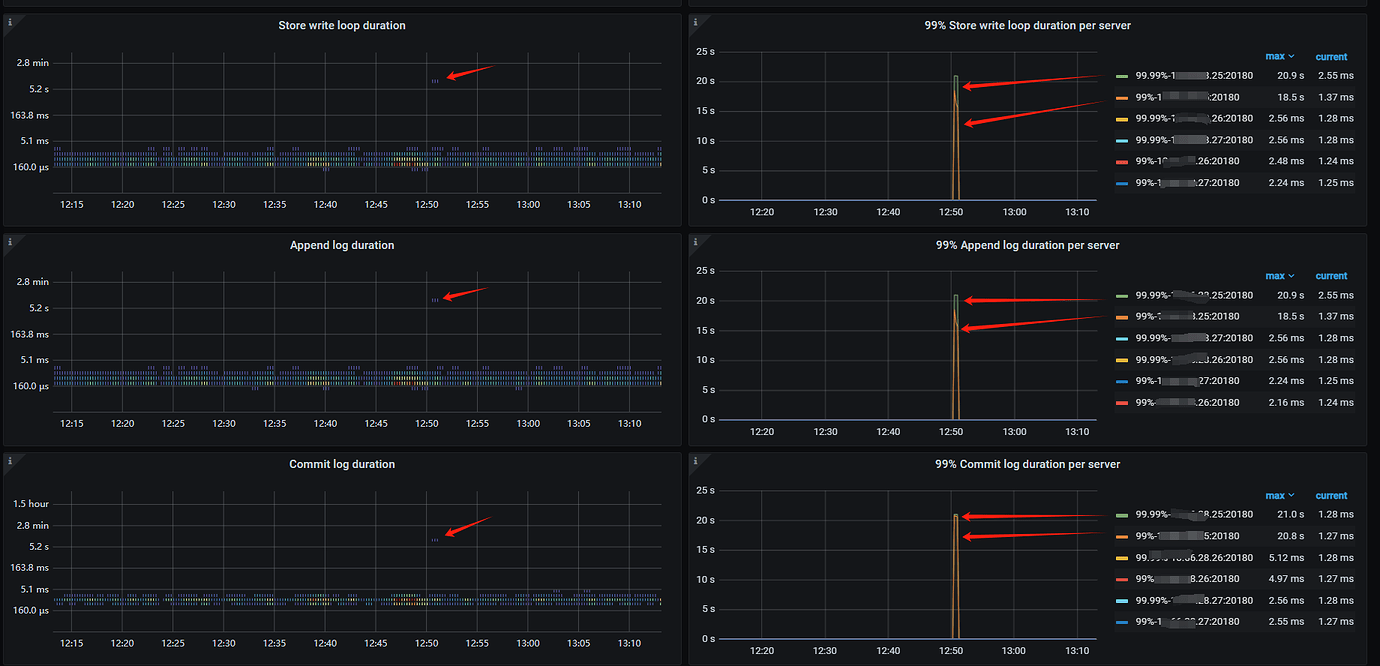
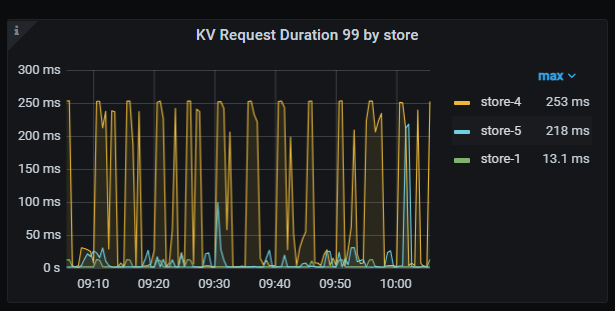
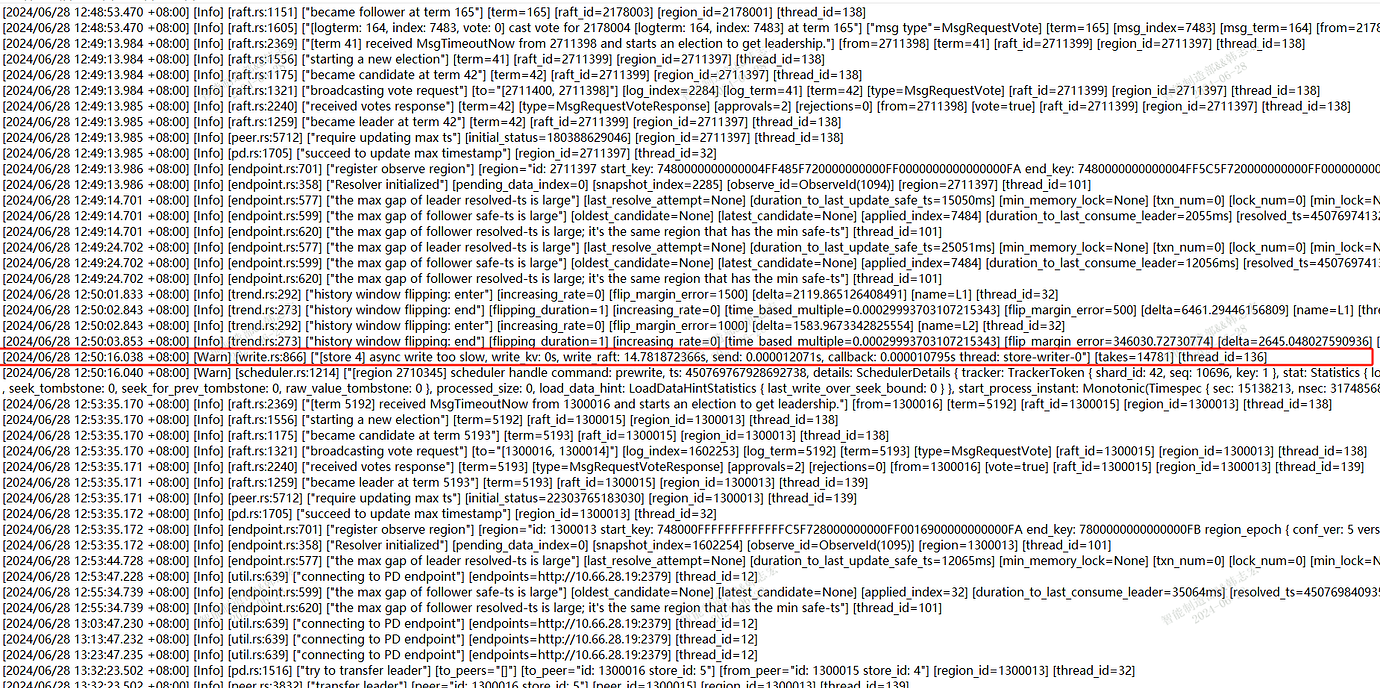
The TiDB database is configured with a total of 9 nodes, 3 PD, 3 TiDBServer, and 3 TiKV (25, 26, 27). Recently, there has been an intermittent write performance issue. When the problem occurs, simple SQL updates take more than 10 seconds to execute. There is no obvious pattern to the fault, and the occurrence time and the SQL execution time are not fixed. Checking the host parameters during the fault, there are no significant changes in CPU, memory, disk IO, or network parameters. Using the “Slow Query” feature in the dashboard, I located the slow SQL updates and found that the time-consuming part is mainly in the “Prewrite phase”. In the logs of node 25 on the dashboard, there is an error at the same time point: “[store 4] async write too slow, write_kv: 0s, write_raft: 14.781872366s, send: 0.000012071s, callback: 0.000010795s thread: store-writer-0”] [takes=14781] [thread_id=136]", which I understand to mean that the raft log write time took 14.7 seconds. Based on this clue, I checked the TiDB parameters on the Grafana system and ruled out several possible causes:
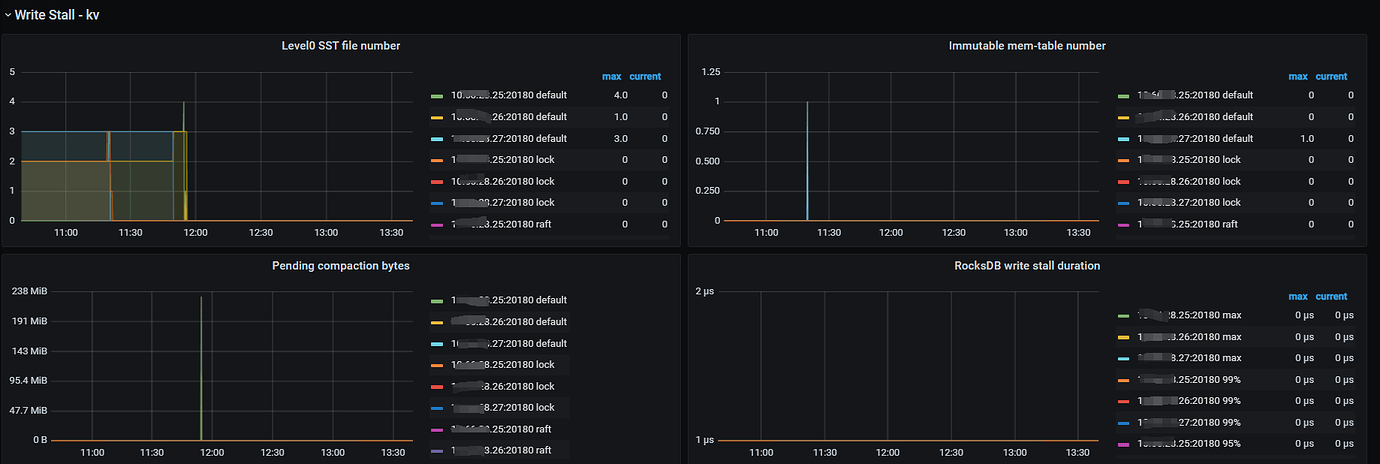
- Ruled out short-term performance issues caused by region compression. (The parameters under write Stall kv are normal with no significant changes)
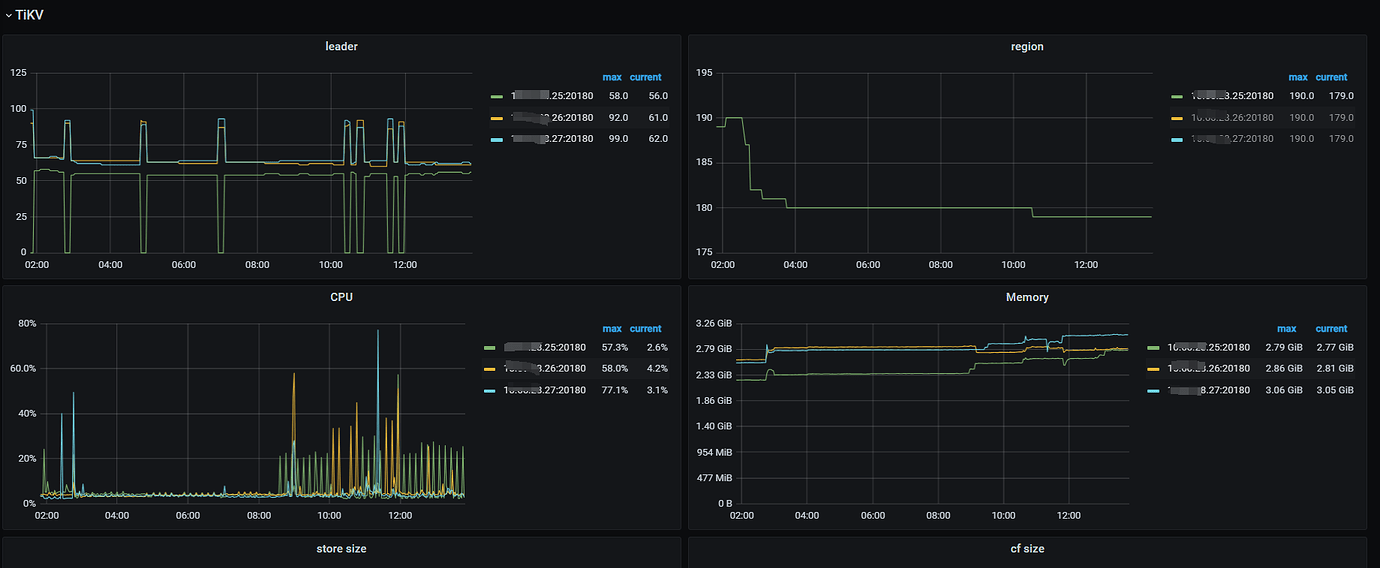
- Ruled out write pressure issues caused by uneven region distribution. (The region parameters on the db-bigdata-accdb-Overview panel are normal)
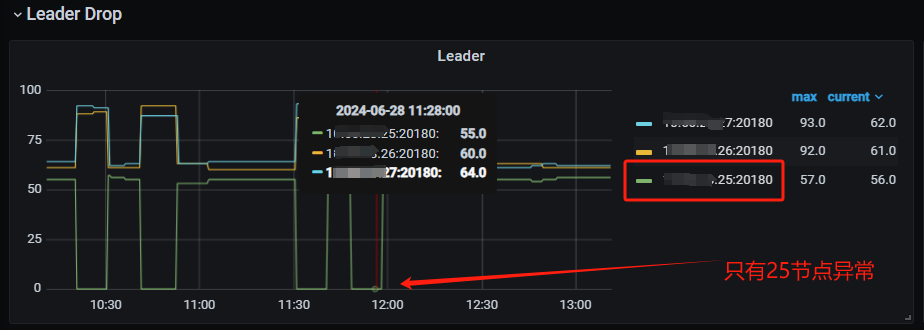
Currently, I suspect the issue is with the raft log writing on node 25. Multiple slow SQLs were sampled, and it was found that they all occurred on node 25. For the fault case at 12:50, it also occurred on node 25. Additionally, the Append Log and Commit Log times on node 25 at 12:50 exceeded 10 seconds. Another abnormal issue found in the logs is that node 25 frequently has transfer leader events, and sometimes the leader on node 25 directly drops to 0, while nodes 26 and 27 do not have this issue.
The problem is still occurring frequently and has not been resolved. I have only been using the TiDB database for six months and do not have much experience. I would appreciate it if experts and professionals in the forum could help analyze the possible causes and provide some suggestions for resolution. Thank you very much!
[Resource Configuration] Enter TiDB Dashboard - Cluster Info - Hosts and take a screenshot of this page

[Attachments: Screenshots/Logs/Monitoring]
CPU, Memory
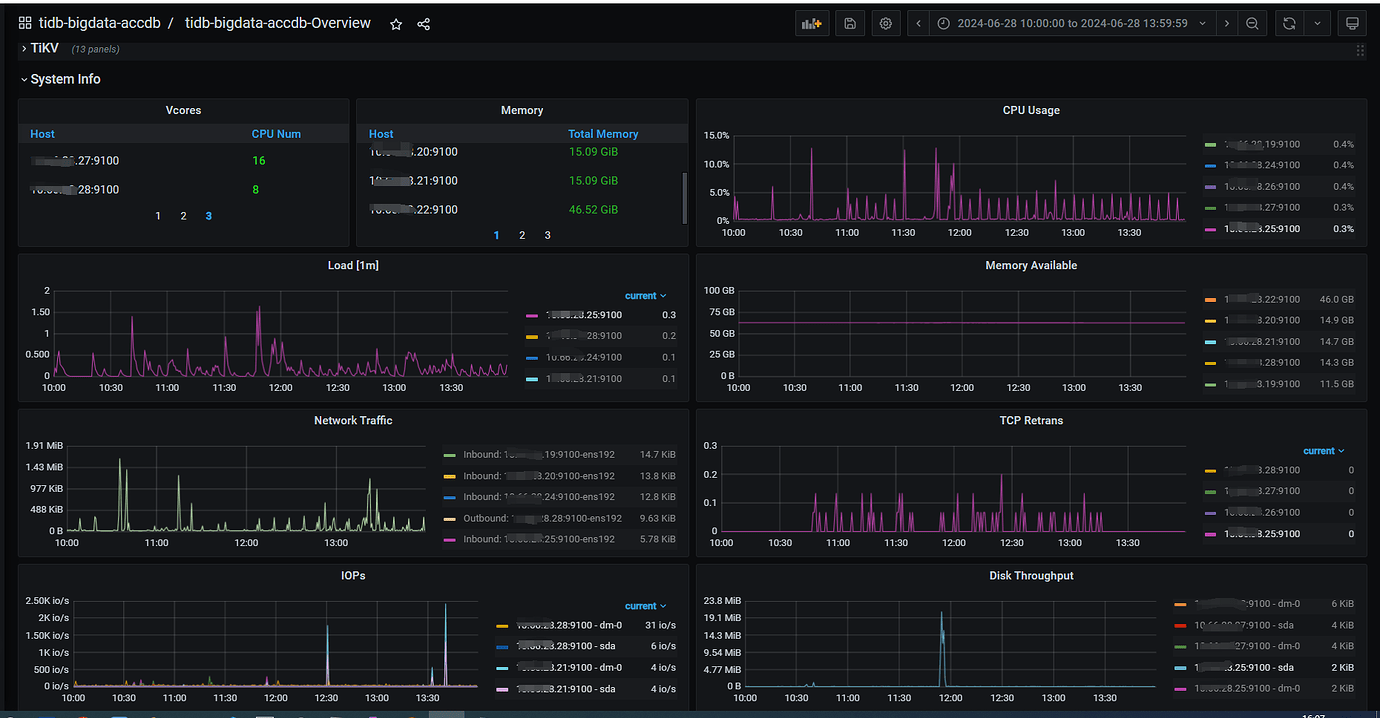
Disk
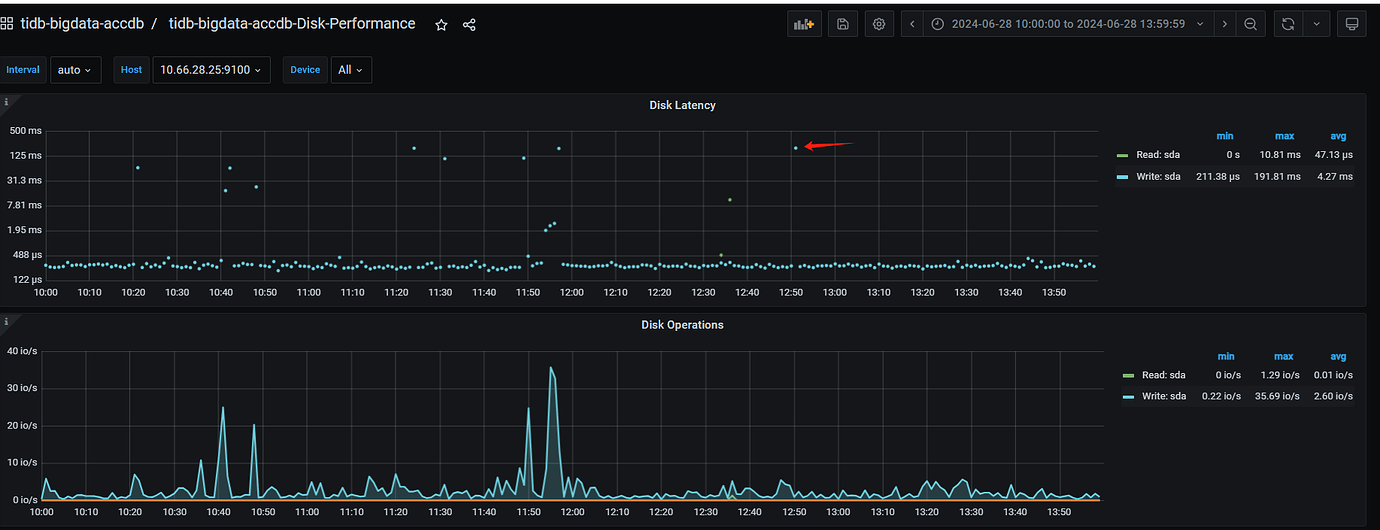
Disk of node 25
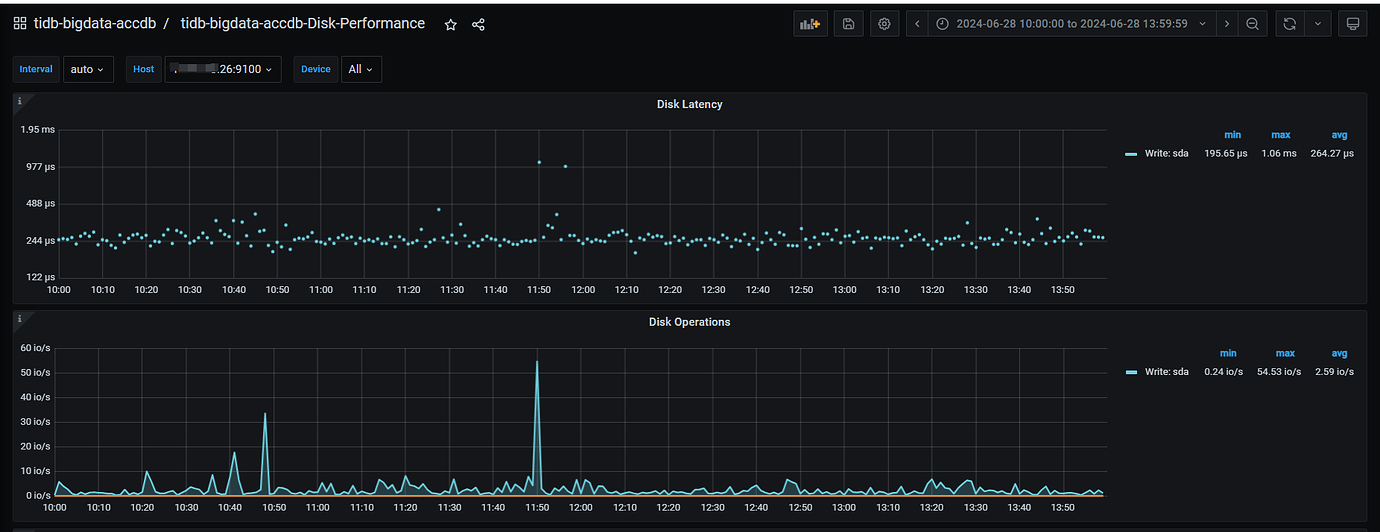
Disk of node 26
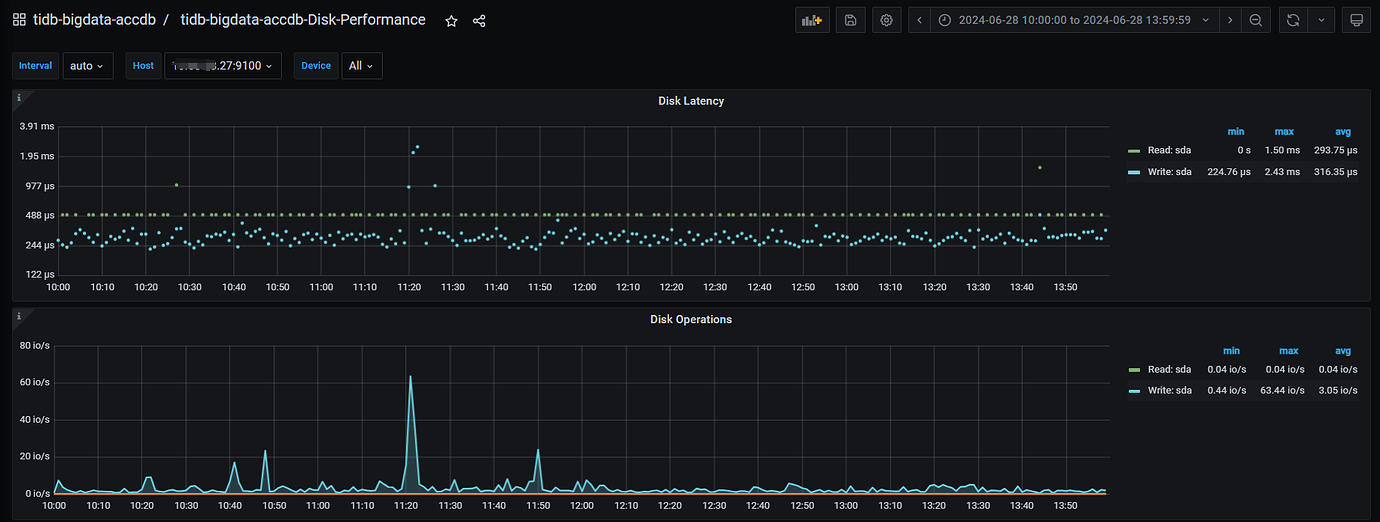
Disk of node 27
Logs
logs-tikv_10.66.28.25_20160.zip (3.3 KB)
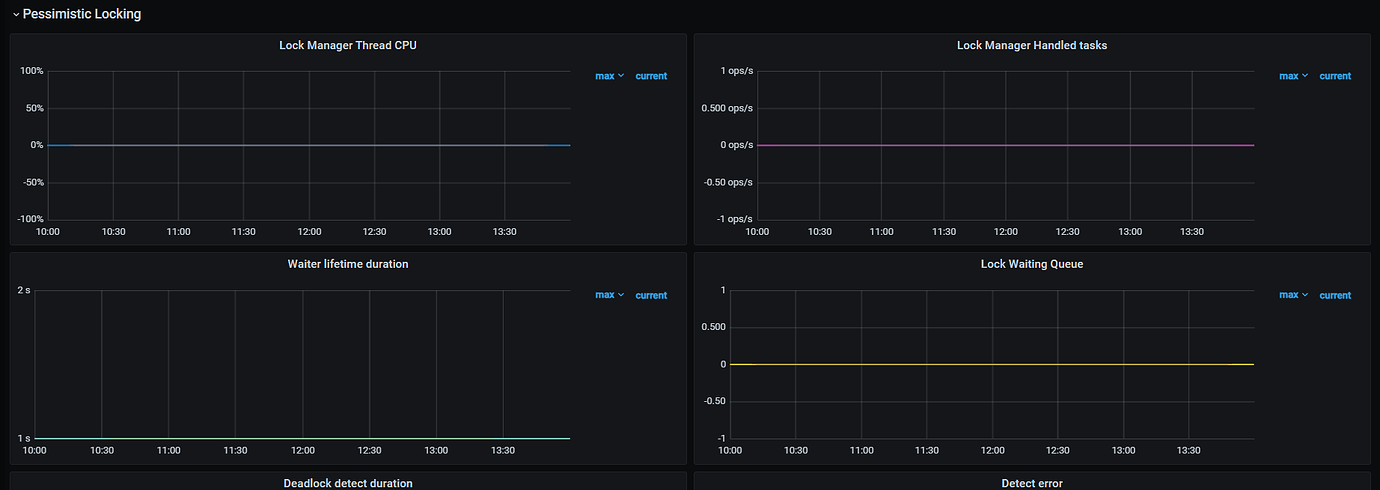
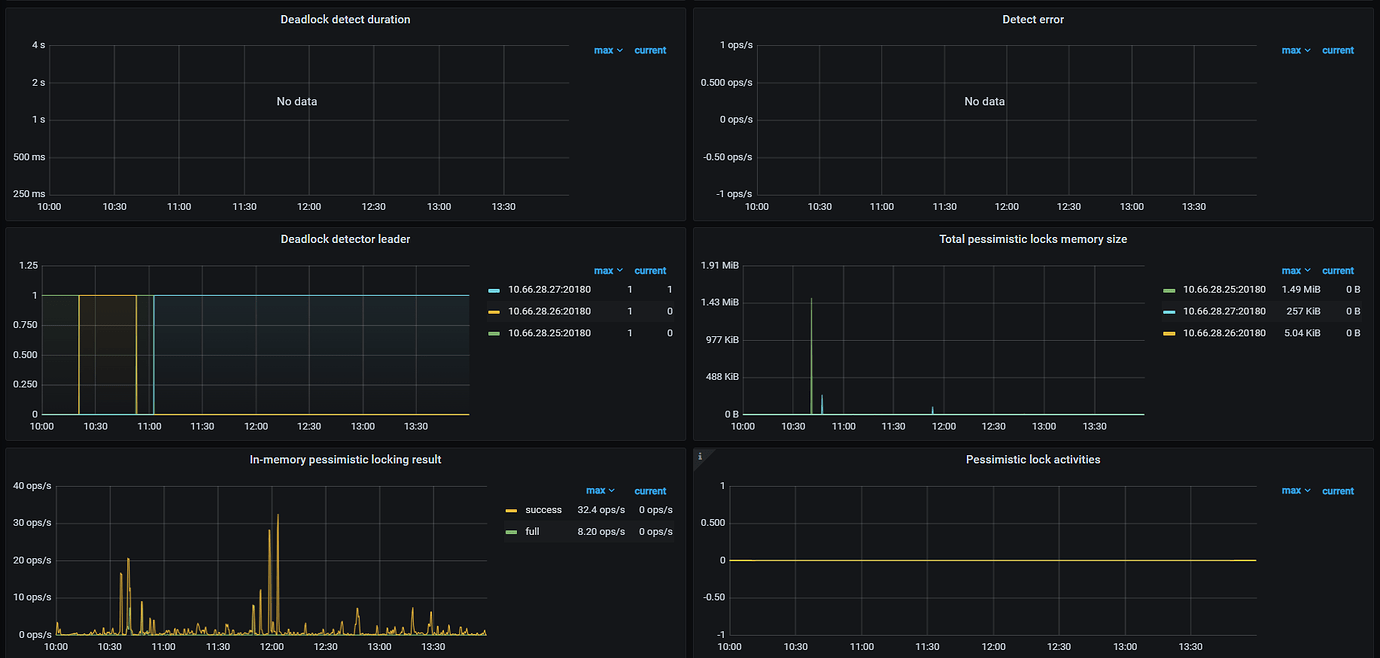
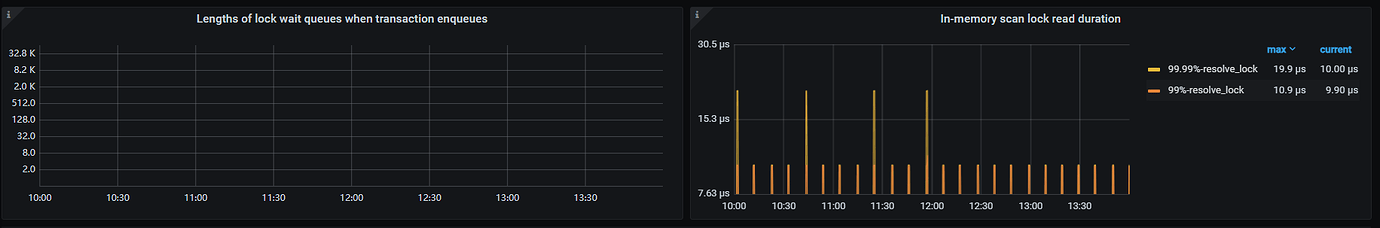
Lock Statistics