Note:
This topic has been translated from a Chinese forum by GPT and might contain errors.
Original topic: 延迟突然升高1分钟左右导致业务卡顿问题排查
[TiDB Usage Environment] Production Environment / Testing / PoC
[TiDB Version] 2tidb 3pd 3tikv 2ha
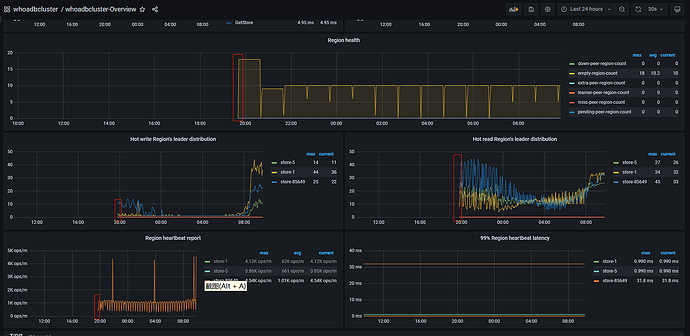
[Reproduction Path] Around 19:39 yesterday, there was a delay increase of about 1 minute, causing business stuttering. When checking the overview, it was found that PD was re-monitored, and IO was normal at that time. There was no error information in the logs. How can this issue be located and troubleshooted? Will replacing the PD loader cause this situation, as shown in the figure:
[Encountered Problem: Phenomenon and Impact]
[Resource Configuration] Go to TiDB Dashboard - Cluster Info - Hosts and take a screenshot of this page
[Attachments: Screenshots/Logs/Monitoring]
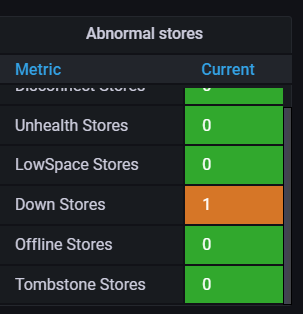
It looks like there is an issue with the TiKV node. Did you stop or decommission the node?
At this time, no stop or offline TiKV nodes have been performed, but the information of the previously offline TiKV nodes is still displayed in the monitoring.

Check the logs of the down TiKV node for any anomalies, and also check the TiKV monitoring for any anomalies.
Check the store using pd-ctl.
There is information about the offline TiKV nodes in the store.
Down, same as this status

Please send a screenshot of the pd-ctl store.
The image you provided is not accessible. Please provide the text content that needs to be translated.
Switching the PD leader might restore it.
This TiKV node has already been scaled down and does not need to be restored. The question now is why this node’s information suddenly reappeared in the monitoring. It might be because I didn’t clean up the information properly before.
We have encountered this issue before. It occasionally occurs when the PD leader switches to an old node, but switching back resolves it. It seems to be a caching problem.


