Note:
This topic has been translated from a Chinese forum by GPT and might contain errors.Original topic: IO利用率爆表
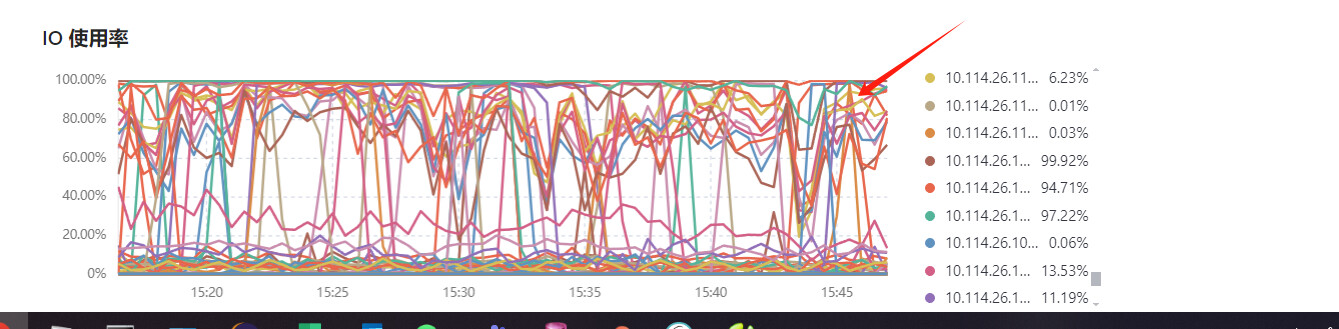
Some hard drives have an IO usage rate that stays above 90% for a long time. Have you encountered this before?
Note:
This topic has been translated from a Chinese forum by GPT and might contain errors.Original topic: IO利用率爆表
Some hard drives have an IO usage rate that stays above 90% for a long time. Have you encountered this before?
What operations have been done currently? Check the slow SQL, is there more statistical SQL during the weekend?
There doesn’t seem to be any issue with slow queries; it’s been consistently high for the past few months.
I am currently transferring TiKV. The process of taking TiKV offline has been ongoing for almost 2 hours and still hasn’t completed. I don’t know what’s going on.
Sort by total execution time in descending order and see. It could also be caused by the TiKV going offline.
Previously, the IO was very high. Now, after taking 3 TiKV nodes offline, the offline command was executed successfully, but it has been offline for a long time and is still in the process of going offline. The logs show:
[2024/03/09 21:45:30.574 +08:00] [INFO] [advance.rs:296] [“check leader failed”] [to_store=183] [error=“"[rpc failed] RpcFailure: 12-UNIMPLEMENTED"”]. I wonder if this is the reason.
Are the three instances that exceed 90% in the picture deployed on the same machine?
Wait until the TiKV node is taken offline and then check again. If the workload is not heavy and there are no slow SQL queries, pay attention to whether there are any issues with the disk.
The TiKV that needed to be taken offline has been taken offline. I have balanced the TiKV, and now the IO has dropped to around 85% with some fluctuations.
There is no solid-state drive installed, running the database is 100% normal.
Check the disk read/write latency under Disk in Grafana’s Tidb-Cluster-Node_exporter to see how the disk performance is. For example, a write latency of generally within 3ms is preferable.