Note:
This topic has been translated from a Chinese forum by GPT and might contain errors.
Original topic: TIKV所有节点IO util 100%正常吗?
[TiDB Usage Environment] Production Environment
[TiDB Version] v4.0.9
[Reproduction Path] What operations were performed when the issue occurred
[Encountered Issue: Issue Phenomenon and Impact]
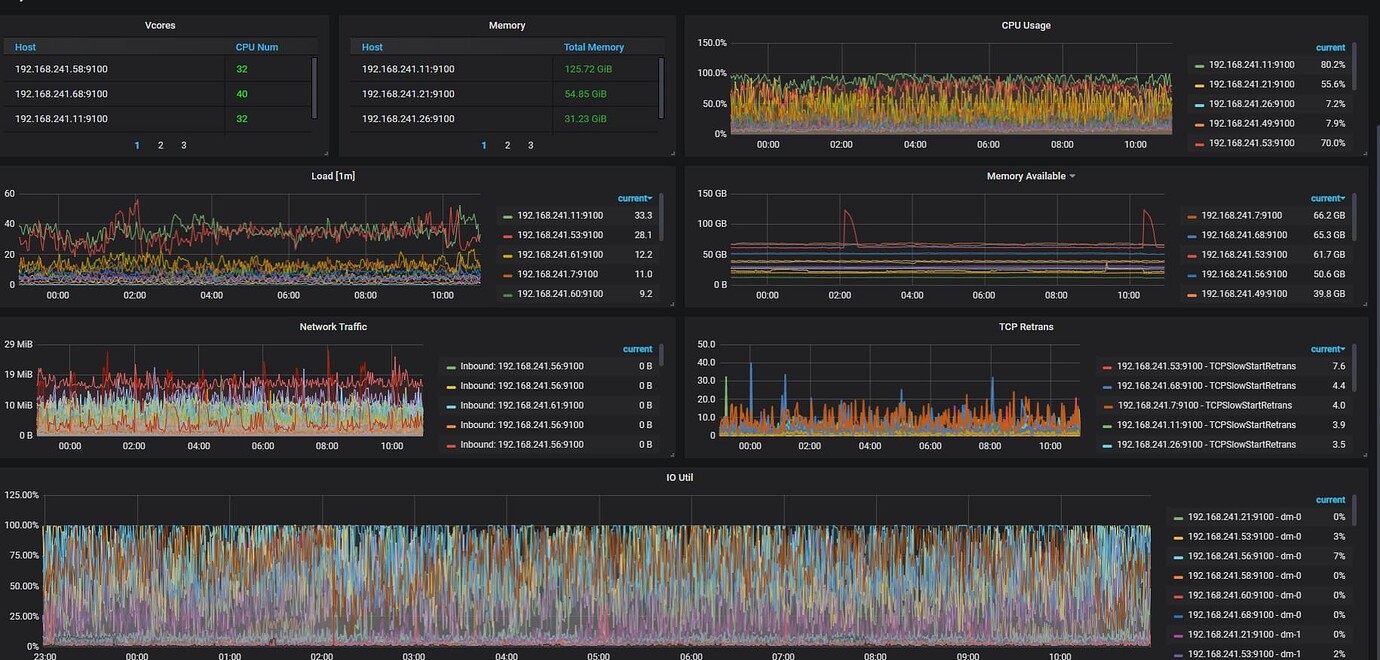
The IO load on the cluster’s TiKV nodes is very high. Is this state normal? Is it a version issue or something else? The version I am currently using is a bit old. Will upgrading the version improve the IO?
PS: Our TiKV nodes are all regular SATA SSDs, not NVMe SSDs.
[Resource Configuration]
[Attachments: Screenshots/Logs/Monitoring]
Refer to these~
It seems that the hardware does not meet the requirements. First, check whether the disk performance meets the requirements.
By
sudo fio -ioengine=psync -bs=32k -fdatasync=1 -thread -rw=randread -size=10G -filename=fio_randread_test -name='fio randread test' -iodepth=4 -runtime=60 -numjobs=4 -group_reporting --output-format=json --output=fio_randread_result.json
The tested rand read IOPS should not be less than 40000.
By
sudo fio -ioengine=psync -bs=32k -fdatasync=1 -thread -rw=randrw -percentage_random=100,0 -size=10G -filename=fio_randread_write_test -name='fio mixed randread and sequential write test' -iodepth=4 -runtime=60 -numjobs=4 -group_reporting --output-format=json --output=fio_randread_write_test.json
The tested rand read IOPS should not be less than 10000.
The seq write IOPS should not be less than 10000.
By
sudo fio -ioengine=psync -bs=32k -fdatasync=1 -thread -rw=randrw -percentage_random=100,0 -size=10G -filename=fio_randread_write_latency_test -name='fio mixed randread and sequential write test' -iodepth=1 -runtime=60 -numjobs=1 -group_reporting --output-format=json --output=fio_randread_write_latency_test.json
The tested rand read latency should not be higher than 250000ns.
The seq write latency should not be higher than 30000ns.
Is the IO util of the NVMe disk at 100%? This metric doesn’t seem to be very accurate on NVMe disks.
The response from my cousin is very professional. Is it really from my cousin?
Not from a search~ hhhhhh
What is the usual IO utilization? Did it only reach 100% for a certain period of time?
When IO utilization reaches 100%, the read and write operations of your system should be very slow, and the business response will basically be extremely sluggish.
It should be due to the low IO performance of the hard disk.
I would like to ask: Are there any optimizations for IO in the new versions?
The IO level has always been as shown in the picture 
It’s just that some nodes are lower and some nodes are higher.
This CPU doesn’t seem low either. Are there any slow SQL queries or something?
While monitoring, also check the hotspot distribution of the SQL. From your screenshot, it looks like the cluster is deployed on Kubernetes, right? How is the storage set up? The monitoring shows that the load on two of the KV nodes is a bit high.
There are also slow SQL queries, but not many.
It’s not deployed on k8s, it’s on physical machines in the data center.
It looks like there are multiple nodes on one machine. Are the storage of each TiKV node physically isolated?
Yes, each TiKV is a separate physical machine with its own SATA SSD.
The IO util value refers to the amount of time per second that IO operations are occurring, representing the duration of IO. It does not truly indicate that the IO load has reached a bottleneck. The most important thing is to see if the SQL response has slowed down.