Note:
This topic has been translated from a Chinese forum by GPT and might contain errors.
Original topic: 一个tikv节点gc worker cpu参数在几分钟内持续达100%,同时延迟高QPS低是这个参数高问题导致的吗?
【TiDB Usage Environment】Production Environment / Testing / PoC
【TiDB Version】3tikv 3pd 3tikv
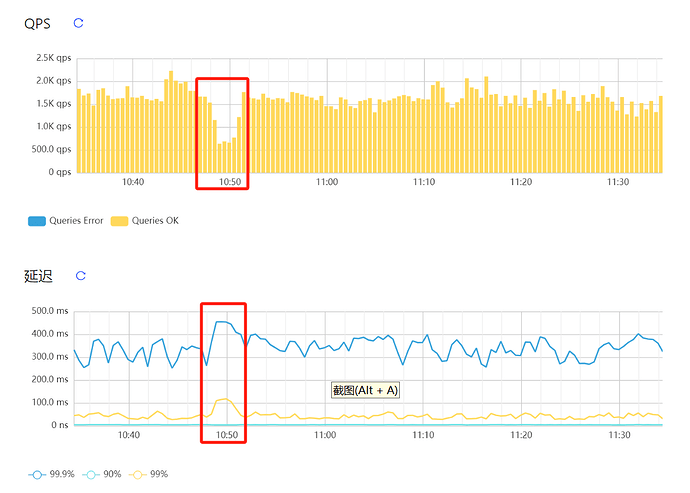
【Reproduction Path】For a few minutes, the GC WORKER CPU of one tikv node reached 100%, during which latency increased and QPS decreased. Is the 100% GC WORKER CPU the reason for the increased latency and decreased QPS at that time? As shown in the figure:
【Encountered Problem: Problem Phenomenon and Impact】
【Resource Configuration】Go to TiDB Dashboard - Cluster Info - Hosts and take a screenshot of this page
【Attachments: Screenshots/Logs/Monitoring】
What is the configuration of the KV node?
How many CPUs does TiKV have? Just one GC worker occupying a CPU would affect other threads, wouldn’t it…
Could it be a mechanical hard drive?
If one slows down, what about the cluster configuration resources, if they are low?
64GB 32 cores solid-state drive
Take a look at the Thread CPU section in the TiKV monitoring. Check the other threads at the corresponding time point. I suspect it’s not just one GC thread that’s high; there should be other threads that directly maxed out the CPU at that time.
GC generally doesn’t consume much resources, there might be other issues.
32C means consuming one C, leaving 31…
The latency is not high. You can check the resource utilization and slow queries of all servers during that time period.
The 100% in the picture refers to the thread, one CPU is fully utilized, I think it’s because TiKV is slow. Check the tikv-details > Thread CPU > Unified read pool CPU to see if TiKV read is fully utilized.
Is it a hybrid deployment?
No, they are all deployed separately.
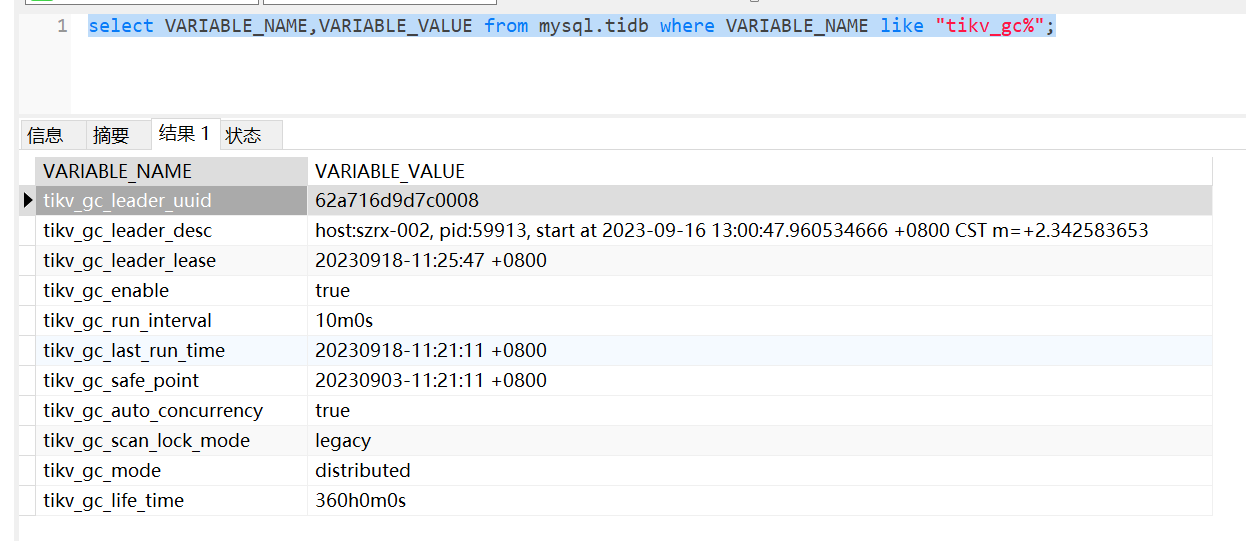
Is the tikv_gc_life_time set to 360h (15 days) a temporary change, or has it always been like this?
tikv_gc_safe_point 20230903
tikv_gc_last_run_time 20230918
There is too much GC data. Extend the monitoring period and see if there is a similar situation in 30 days.
Was the tikv_gc_life_time set to 360h (15 days) temporarily, or has it always been like this? It used to be 3 months, then it was gradually changed to 15 days, and recently it was changed to 1 day. This situation started about a week ago, it wasn’t like this before.


