Note:
This topic has been translated from a Chinese forum by GPT and might contain errors.
Original topic: prometheus 抓取监控数据的时候 有日志记录吗?
Version v6.5.1
The memory and IO captured by the cluster dashboard show anomalies on some machines. How can I view the logs captured by Prometheus?
I checked the logs under tidb-deploy/prometheus-9091/log, specifically prometheus.log. There are only records from 7 AM this morning, and there have been no log entries from 7 AM until now. The log level in the configuration file is set to: info.
The monitoring data for the cluster’s PD, TiDB, and TiKV have always been retrieved via GET.
The logs can be found in tidb-deploy/prometheus-9091/log.
- Check if the node status (UP) on your Prometheus is normal.
- If it is not normal, check the agent status (network status).
- Restart the Prometheus service and observe if it returns to normal.
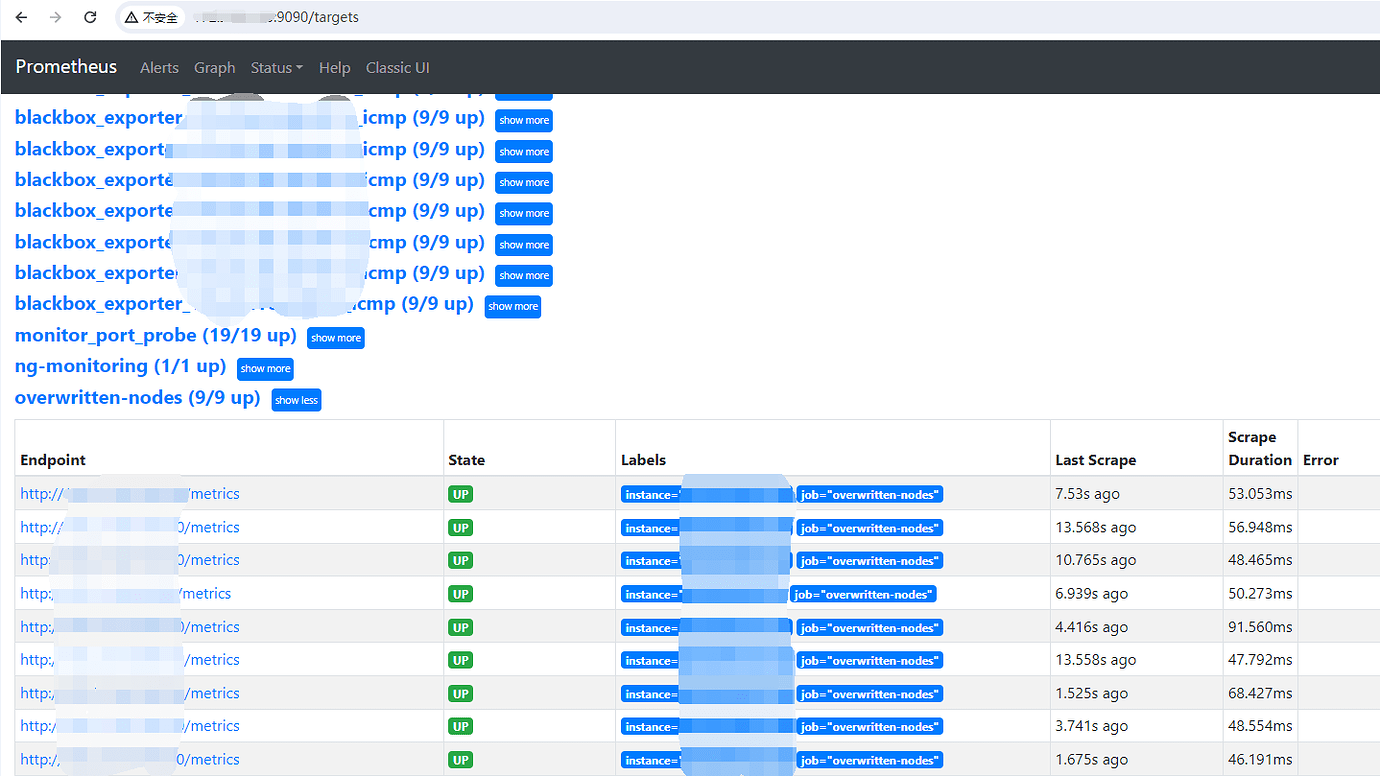
Visit this address
http://{prometheus_ip}:9091/targets
You can see the interval of the last scrape for each target and the duration of the scrape.
It is estimated that some targets are no longer functioning properly.
You can try accessing the URL in front to see if it can return monitoring values normally.
Check the communication status between the server and other servers. Is it an issue with log capturing?
Prometheus is successfully scraping monitoring data from other machines. This machine communicates normally with other clusters, with no anomalies or alerts, and the usage of IO, CPU, and memory resources is not extreme. However, the SQL running on the current machine is taking an exceptionally long time.
This can show the last connection record, but how can I see the history?
Prometheus itself has a time-series database, and the data will be stored in the database.
Data is stored in tsdb
/data/tidb-data/prometheus-8249
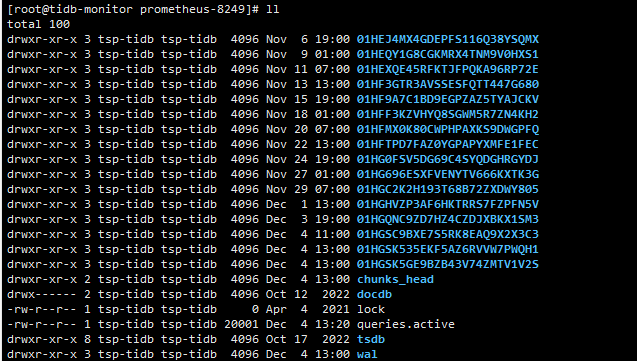
This is the collected monitoring data.
I want to see the connection log records, the handshake kind.
Why is TiDB’s memory usage 0 here?
Similar to this /data/tidb/tidb-deploy/prometheus-9091/log
But this does not record the
ip of the monitored machine.
Historical issues, indeed, are difficult to analyze.
If there is no data, it means that no data was collected.
The target call at that moment must have failed.
There are no such detailed records; the overhead is too high.
This topic was automatically closed 60 days after the last reply. New replies are no longer allowed.