Is this a normal situation that duration is higher when the number of request decreased after reaching peak?

Hi, I’m new to TiDB and trying to test performance of it.

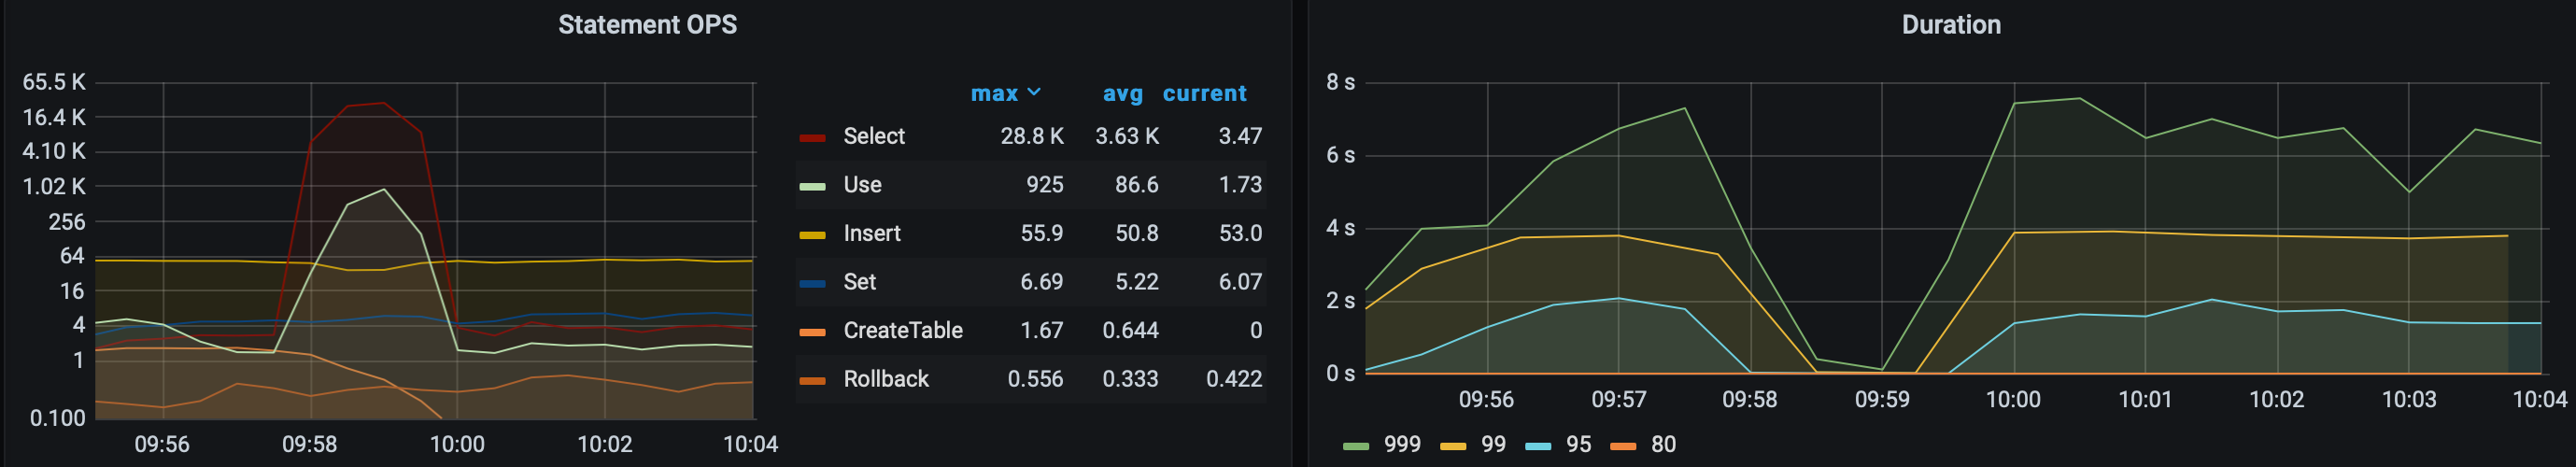
The below screenshot shows the statement OPS and the Duration and yes, trying to select massive amount of data.

I’m curious about the duration that shows shorter value when the number of OPS value is high and vice versa.

According to my short knowledge, I thought it should have long duration when OPS are high. Can anybody explain about this situation?

Thanks in advance!

Yes, it is a little weird. But it depends on your workload, there are some possible reason:

  1. the select workload requiring the same range data that can be cache, so the duration are lower
  2. Are there any background tasks are running? Like Auto Analyze(Introduction to Statistics | PingCAP Docs) and GC(GC Overview | PingCAP Docs)

Thanks for your answer!

  1. Is there anyway to check what tables or rows are cached in the system?
  2. Not sure about it. Those Auto Analyze and GC running every time when query has submitted? or if it’s not, how Can I see them running?
  1. Block cache hit, Please refer to Key Monitoring Metrics of TiKV | PingCAP Docs
  2. GC worker CPU in Grafana.
  3. In terms of auto analyze, you can find the running and historical tasks by ‘show analyze status;’ SHOW ANALYZE STATUS | PingCAP Docs

Ah yes seems like cache system was worked at that time. Thanks for answering!