Note:
This topic has been translated from a Chinese forum by GPT and might contain errors.
Original topic: tidb 5.4.0 dashboard问题
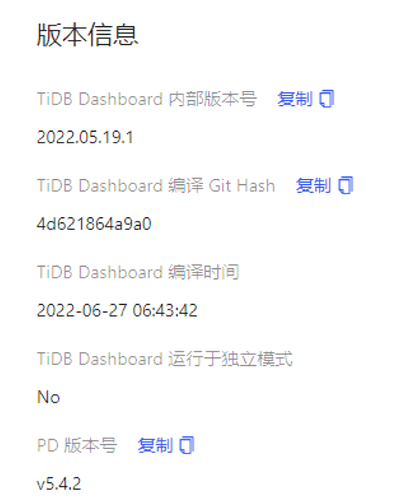
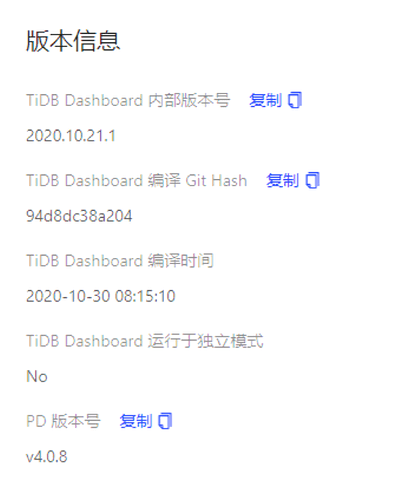
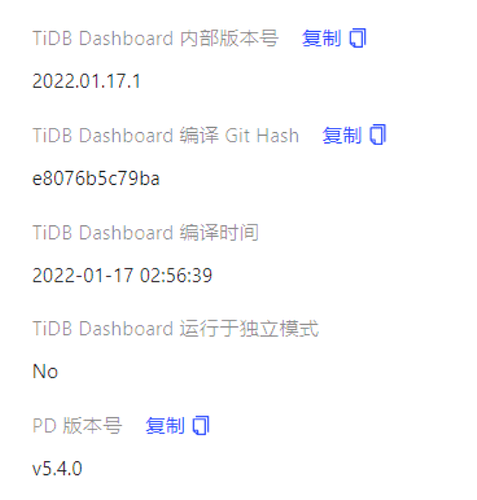
The “Max Memory” option in the slow query dashboard is missing in versions 5.4.0 and 5.4.1, but it is still available in versions 4.0.8 and 5.4.2.
The “Max Memory” option for slow queries in the dashboard is missing in versions 5.4.0 and 5.4.1, but it is still available in versions 4.0.8 and 5.4.2.
Dashboard versions are as follows:
This should be a known bug that has been fixed subsequently. You can refer to this post Dashboard慢查询界面缺少列 - TiDB 的问答社区
Or you can query through SQL, the effect is the same
SELECT
INSTANCE instance, Time time, REPLACE(Query, ’ ', ‘’) query statement, Query query statement, Process_keys, Total_keys, Total_keys - Process_keys,
case when Query_time < 1 then CONCAT(ROUND(Query_time * 1000, 1), ‘ms’)
when Query_time < 60 then CONCAT(ROUND(Query_time, 1), ‘s’)
when Query_time < 3600 then CONCAT(ROUND(Query_time / 60, 1), ‘min’) end query duration,
case when Mem_max < 1024 then CONCAT(Mem_max, ‘B’)
when Mem_max < 1048576 then CONCAT(ROUND(Mem_max / 1024, 1), ‘KiB’)
when Mem_max < 1073741824 then CONCAT(ROUND(Mem_max / 1048576, 1), ‘MiB’)
when Mem_max < 1099511627776 then CONCAT(ROUND(Mem_max / 1073741824, 1), ‘GiB’) end memory usage
FROM INFORMATION_SCHEMA.CLUSTER_SLOW_QUERY t
WHERE time BETWEEN ‘2022-01-01 07:00:00’ AND ‘2022-01-01 18:00:00’
ORDER BY t.Mem_max DESC
LIMIT 1000;
This topic will be automatically closed 60 days after the last reply. No new replies are allowed.


