Note:
This topic has been translated from a Chinese forum by GPT and might contain errors.
Original topic: Lightning导入数据后,tiflash同步的问题
Version: 6.1.0
Using Lightning to import CSV data, over 800GB, with 32 threads
It took 1.5 hours and indicated a successful import
After the successful import, TiKV was okay, but TiFlash was not ready and took another 3 hours to become available
During these 3 hours, the replica synchronization in the tiflash_replica table showed 100%, but actually querying TiFlash storage would get stuck and not respond
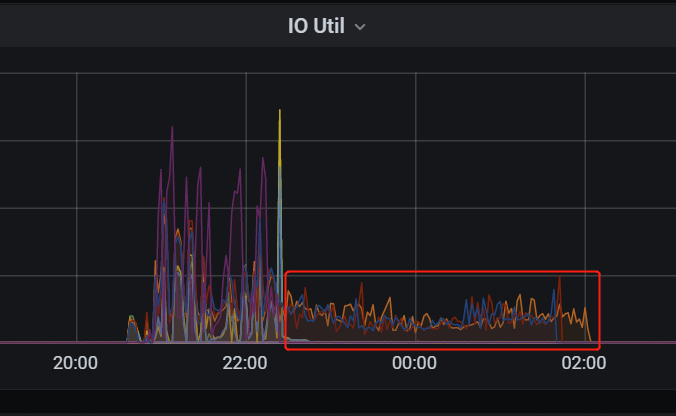
Resource usage is shown in the images below. You can see that after the import ended, there was a low-load state for another 3 hours
My questions are:
-
Is this a normal phenomenon?
-
Is there a switch to speed up this 3-hour process?
Is there an expert who can provide some guidance?
-
The phenomenon is abnormal, this requires monitoring and log analysis.
-
Slow synchronization may be caused by various reasons, you can troubleshoot by following these steps.
-
Adjust the scheduling parameter values.
- Adjust the load on the TiFlash side. Excessive TiFlash load can cause slow synchronization. You can check the load of various metrics through the TiFlash-Summary panel in Grafana:
Applying snapshots Count: TiFlash-summary > raft > Applying snapshots CountSnapshot Predecode Duration: TiFlash-summary > raft > Snapshot Predecode DurationSnapshot Flush Duration: TiFlash-summary > raft > Snapshot Flush DurationWrite Stall Duration: TiFlash-summary > Storage Write Stall > Write Stall Durationgenerate snapshot CPU: TiFlash-Proxy-Details > Thread CPU > Region task worker pre-handle/generate snapshot CPU
Adjust the load according to business priorities.
Thank you for the help!
It is a verification cluster, and there is no other load on the TiFlash side during synchronization. All indicators are very low according to the monitoring panel.
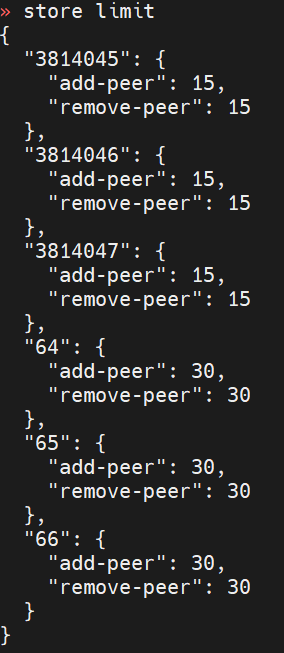
The current parameters for store limit are as follows. What would be an appropriate adjustment?
There is no fixed value; it mainly depends on the machine load. You can try multiple times to find a suitable value.
If the machine’s performance is reasonable, the delay shouldn’t be this long.
Okay, I increased it and tried again. In terms of performance, I indeed didn’t see any load; CPU/memory/IO/network are all very low.
I have adjusted the store limit to the maximum of 200, but it still takes three to four hours, and resource usage remains very low. Is there anything else I can do?

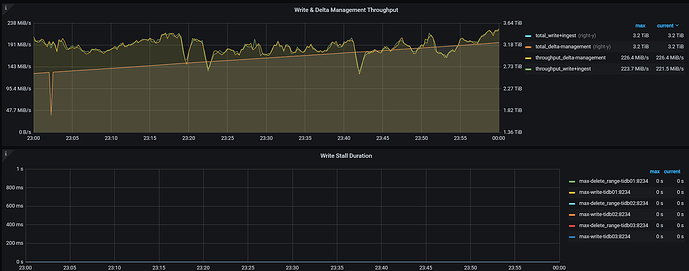
Please send the complete monitoring of TiFlash according to this. Let’s analyze it.
Captured one of the hours
tiflash-learner.toml
[server]
engine-addr = The address for external access to the TiFlash coprocessor service
[raftstore]
## Number of threads in the thread pool handling Raft data persistence
apply-pool-size = 4
## Number of threads in the thread pool handling Raft, i.e., the size of the Raftstore thread pool.
store-pool-size = 4
## Number of threads handling snapshots, default is 2. Set to 0 to disable multi-thread optimization
snap-handle-pool-size = 2
## Minimum interval for persisting WAL in the raft store. Increase the delay appropriately to reduce IOPS usage, default is “4ms”, set to “0ms” to disable this optimization.
store-batch-retry-recv-timeout = “4ms”
[security]
## Introduced in v5.0, controls whether to enable log redaction
## If this option is enabled, user data in the logs will be displayed as ?
## Default value is false
redact-info-log = false
apply-pool-size and store-pool-size can be adjusted according to the cluster configuration.
snap-handle-pool-size should be 0 by default, and can be adjusted to enable.
Sorry, I didn’t understand what to do, as I just started not long ago.
Should I use tiup cluster edit-config xxx to change the configuration? Or should I find this toml file and manually change it?
Where is this file? What needs to be done after changing it?
I just looked at your monitoring, and the Snapshot processing is relatively slow. So, adjust the parameters a bit; you can test this in the test environment.
You can use tiup cluster edit-config xx.
Additionally, adjust the replica-schedule-limit appropriately, but do not exceed the region-schedule-limit.
I have adjusted the region-schedule-limit and replica-schedule-limit. Is this size sufficient:
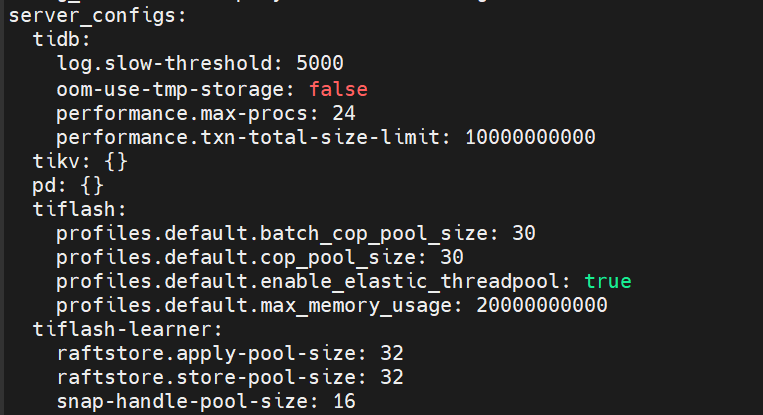
As for the tiflash_learner configuration you mentioned, I’ll try increasing it.
Hello, I would like to confirm what mode is used when importing data with Lightning?
After changing the configuration, the resource usage is still very low, with no difference from before.
It hasn’t finished running yet, but it looks like it will still take three to four hours.
tiup cluster edit-config xx:
Resource usage:
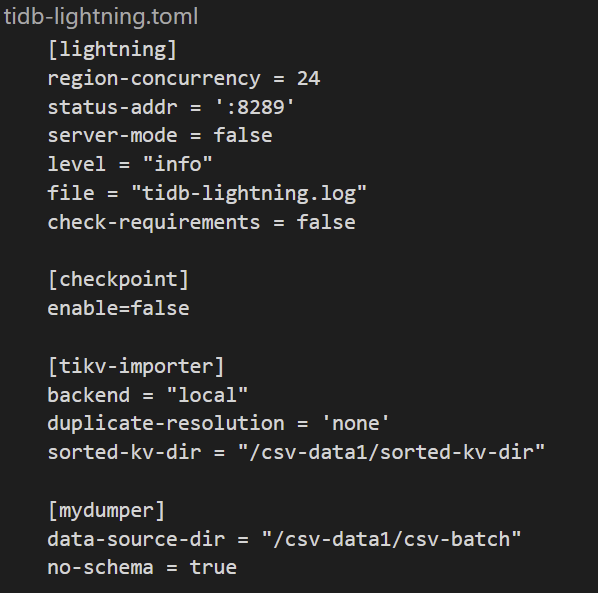
Hello, using the local mode, importing CSV, the configuration is as follows:
 If it’s in local mode, I guess there might be some impact. In local mode, these key-value pairs are uploaded to each TiKV node in the form of SST files, and then TiKV ingests these SST files into the cluster. TiFlash synchronizes TiKV’s data in the form of a region learner.
Well, my concern now is that the synchronization speed is too slow.
It takes an hour and a half to import, and nearly 4 hours to synchronize.
I just want to ask if there is any way to speed it up.


