Note:
This topic has been translated from a Chinese forum by GPT and might contain errors.Original topic: tidb和dm同用一个grafana系统问题
Version 7.5.1
- First, deploy TiDB 7.5.1, with Grafana on a certain host (192.168.0.3), and Grafana monitoring is normal.
- When attempting to deploy DM, also specify Grafana, monitoring, and alertmanager to this host (192.168.0.3). The deployment is successful with no errors, and the TiDB and DM cluster names are different.
Questions:
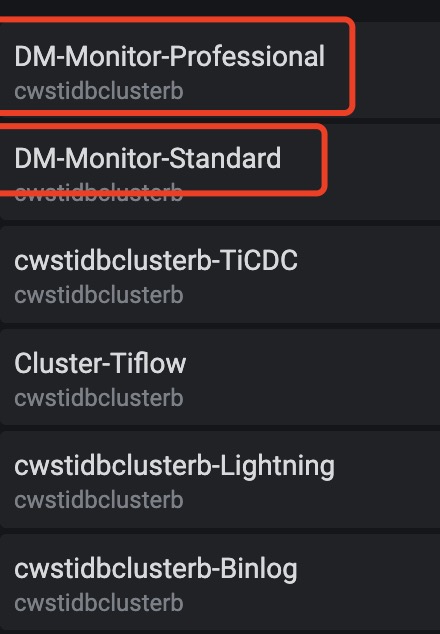
- In the Grafana backend, DM task data is not visible. Is the above deployment plan feasible?
- The monitoring project includes DM and other projects, but the cluster names are different.