Note:
This topic has been translated from a Chinese forum by GPT and might contain errors.
Original topic: k8s grafana 报Templating init failed e.replace is not a function
Grafana: 7.5.17
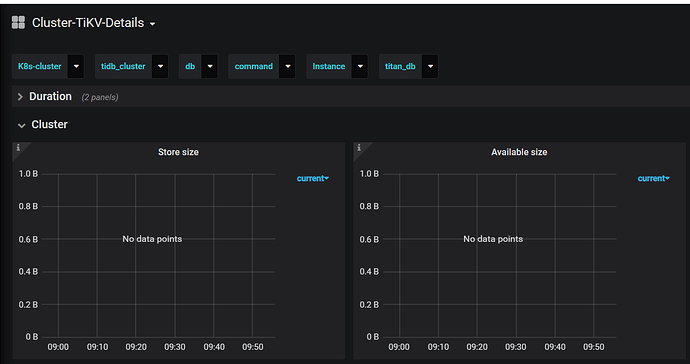
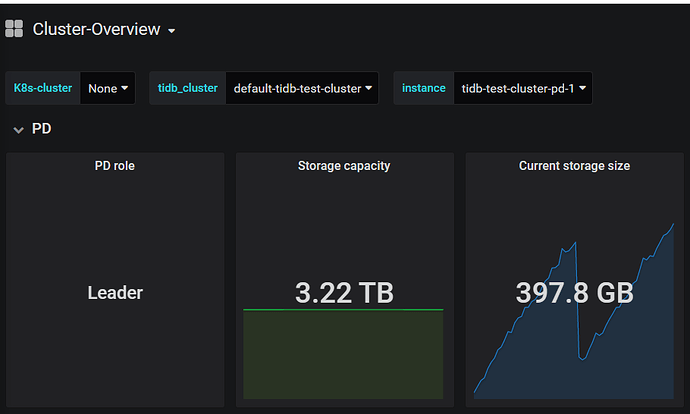
On k8s, Grafana (4c 4G memory) reports “Templating init failed e.replace is not a function” on all pages except the overview page. There are no cluster information variables.

There are quite a few issues with the environment you created 
 . In this situation, you can only check the logs. If that doesn’t work, try collecting diagnostics. I haven’t used this tool before, but you can refer to it and give it a try. Using PingCAP Clinic to Diagnose TiDB Cluster | PingCAP Docs
Deployed k8s using binaries, not sure where the issues are, feels like there are more problems on the network side. Need to start another thread.
Is it a production environment? You can use kubeadmin to install.
For testing, you can use kind.
In the test environment, mainly learn the process first, and then study the kubadm deployment later.
This is pretty good, you can take a look.
Thank you, I will study the system when the time comes.
Take a look and see if there are any critical error messages in the basic-monitor pod logs. Use the command: kubectl -n ${namespace} logs -f ${pod_name}
It looks relatively normal. The time zone hasn’t been adjusted yet, it needs to be set to +8. In the meantime, adjustments were made to the CPU and memory of Prometheus and Grafana.
Is it possible that Prometheus didn’t start before, causing Grafana to not read the data? You can try deleting the Grafana pod and recreating it.
Re-deployed successfully, it should be a version issue. Previously, I was using version 6.x, then switched to the 7.5 image which didn’t work. During the re-deployment, I forgot to change the version in the YAML file the first time, so it still reported the same error with version 6. After changing it and re-deploying, it worked fine.
This topic was automatically closed 60 days after the last reply. New replies are no longer allowed.


