Note:
This topic has been translated from a Chinese forum by GPT and might contain errors.
Original topic: 执行计划执行时间差距大
【TiDB Usage Environment】Production Environment
【TiDB Version】5.0.6
【Reproduction Path】Operations performed that led to the issue
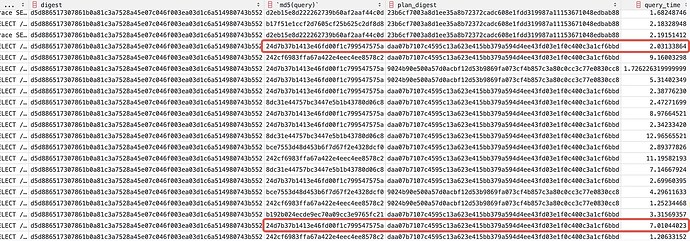
【Encountered Issue: Phenomenon and Impact】The execution time for the same execution plan varies greatly, and different execution plans have varying speeds. It’s unclear which execution plan is optimal. For example, the execution plan “a76a4c820c103f1cb02d1f6d704f9835f5d2ea5b949d9733abb4bd260d44b574” on 11-07 took 13 seconds, while the same plan on 11-08 took only 1 second.
【Resource Configuration】
【Attachments: Screenshots/Logs/Monitoring】
You can check the SQL statement analysis on the dashboard, where it shows the maximum, minimum, and average time.
The same execution plan taking different amounts of time is generally related to the resource consumption of the specific SQL. For example, different variables substituted in the SQL can lead to variations in the amount of data processed, resulting in higher resource consumption and increased time. You can check if there is a better execution plan or optimize the SQL.
Is the data volume consistent? Is the table health consistent?
The query variables are consistent multiple times.
Multiple queries have consistent variables, and the time interval is no more than a few minutes. I also considered the health issue, but at 16:36:06, it took 13s, 6s, and 5s at the same moment.
Is the execution plan the same if the execution time is different?
Do a trace to see which step has the time difference.
Currently, everything is very fast, less than 2 seconds. However, there is a situation where the same execution plan has a significant difference in performance, which I don’t quite understand.
The plan_digest is the same.
Could you please tell me how to do this trace?
There are several scenarios:
- The execution plan is consistent, but the amount of data queried is inconsistent.
- The execution plan is consistent, but there may be blockages in other areas. Specifically, you need to check the statement execution time on the dashboard to see which part is consuming the most time.
The same plan_digest shows a significant difference at the same time.
Is there such a big difference in execution time for running the exact same SQL?
Directly click on the dashboard, open the slow queries, find these specific time points, and check each one individually. Look at the SQL execution time tab to see where the time is being spent, and compare them.
Yes, many reports have this issue. They run 99% of the time without problems, but there are a dozen times when they are slow. I took the MD5 of the query, and the two execution statements and execution plans are the same. The difference is 5 seconds.


