Note:
This topic has been translated from a Chinese forum by GPT and might contain errors.
Original topic: tikv在数据库无插入查询情况下的负载情况
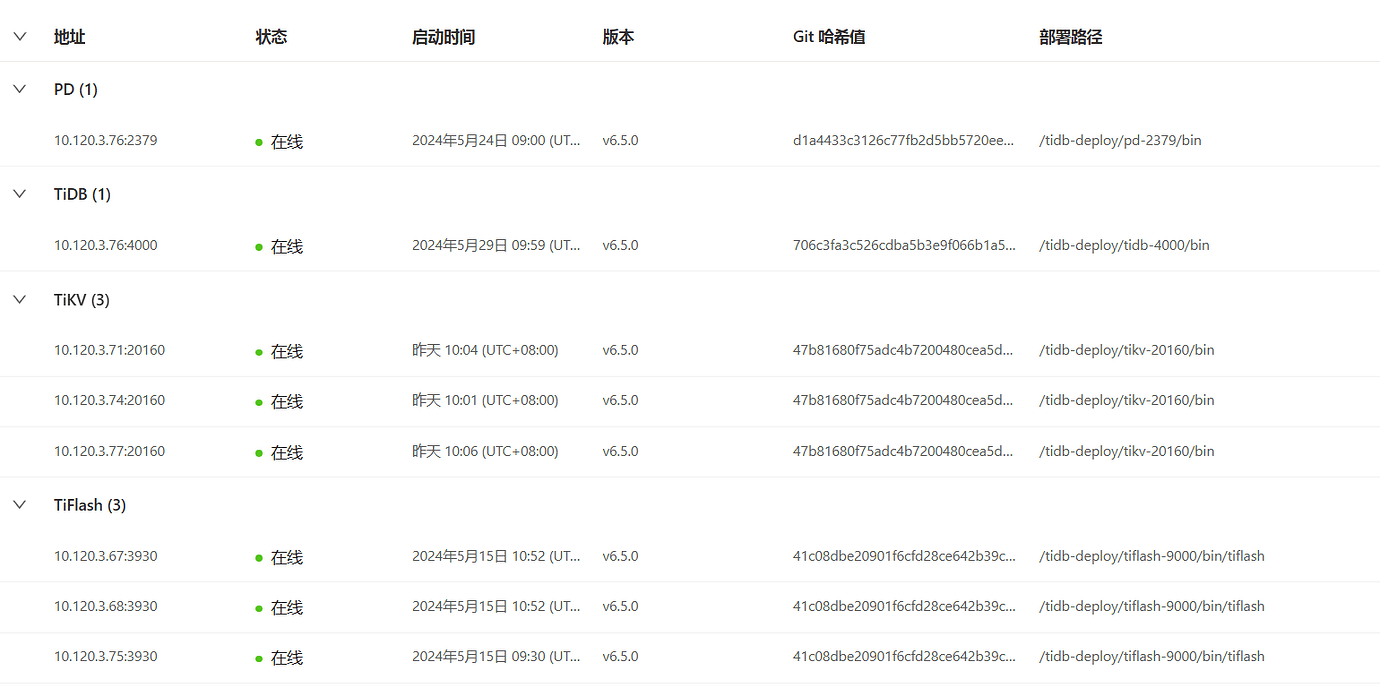
【TiDB Usage Environment】Testing
【TiDB Version】6.5.0
【Reproduction Path】What operations were performed to cause the issue
【Encountered Issue: Issue Phenomenon and Impact】
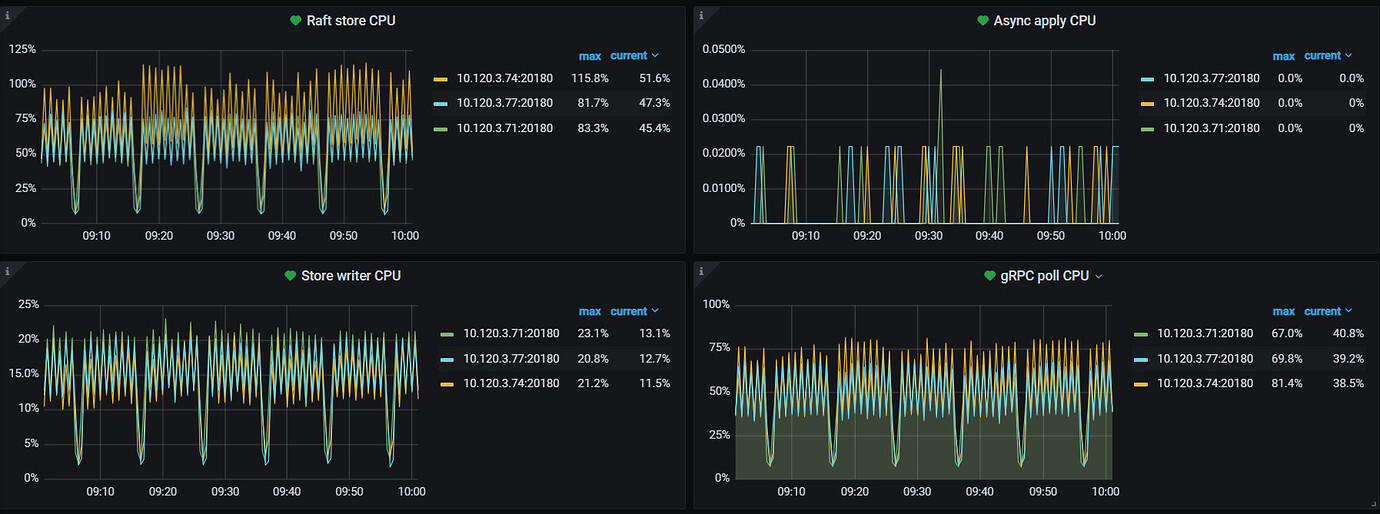
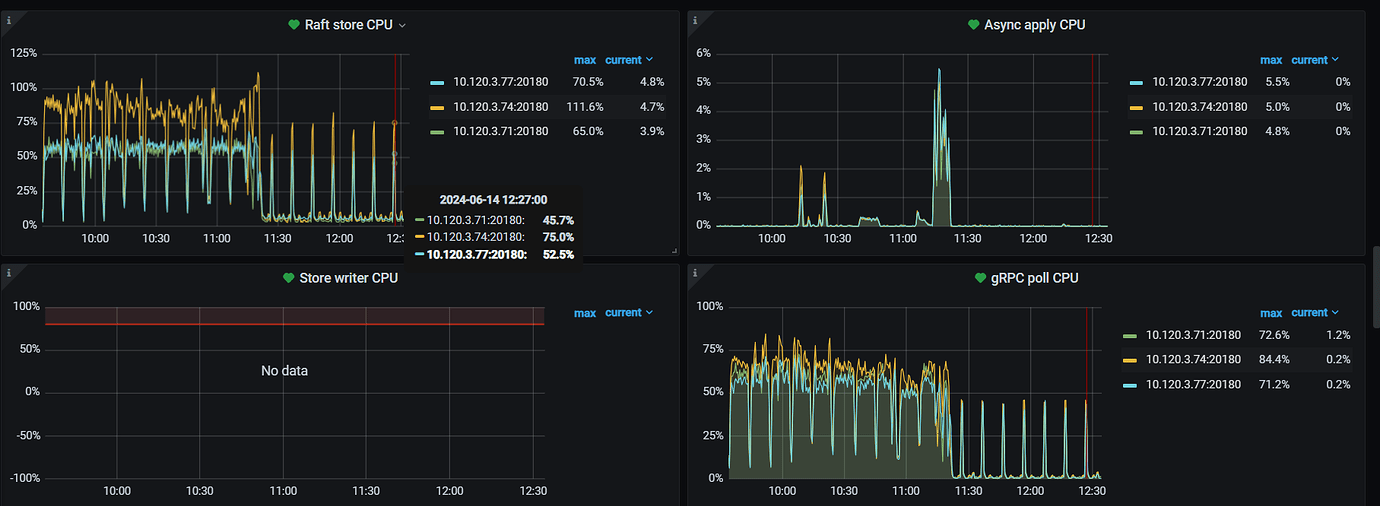
During the interval, the database shows no load and no analyze jobs, but the tikv raft store CPU and grpc poll CPU generate load at a relatively fixed frequency. Is this normal?
【Resource Configuration】
【Attachments: Screenshots/Logs/Monitoring】
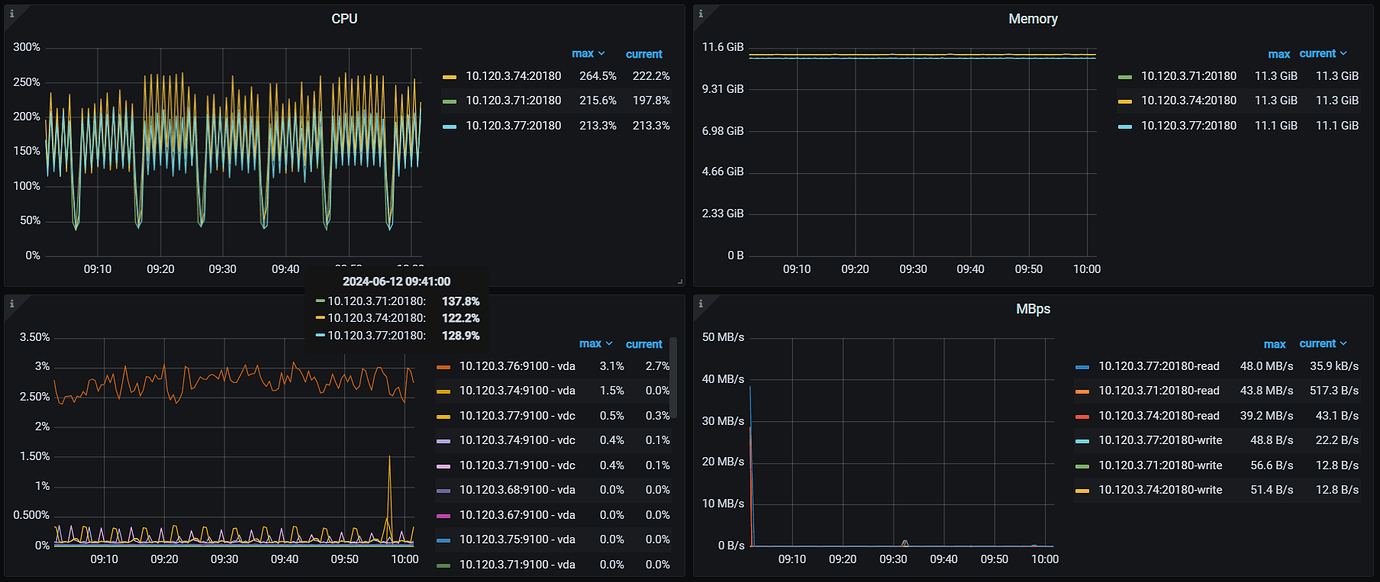
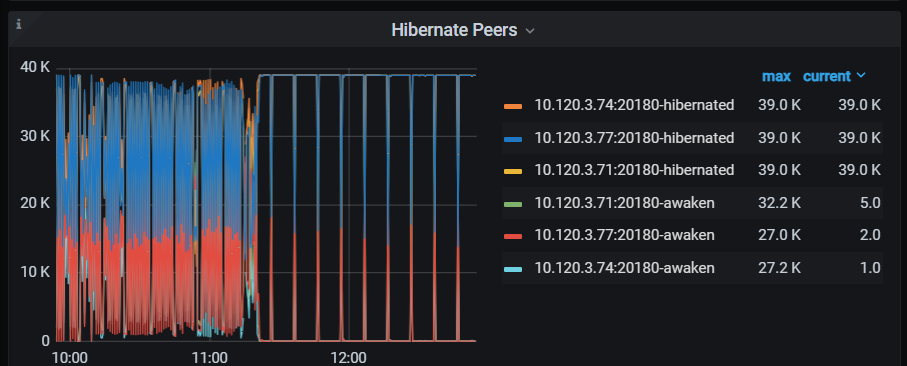
It seems to be related to hibernate region, but why are regions still being awakened when the cluster is under no load?
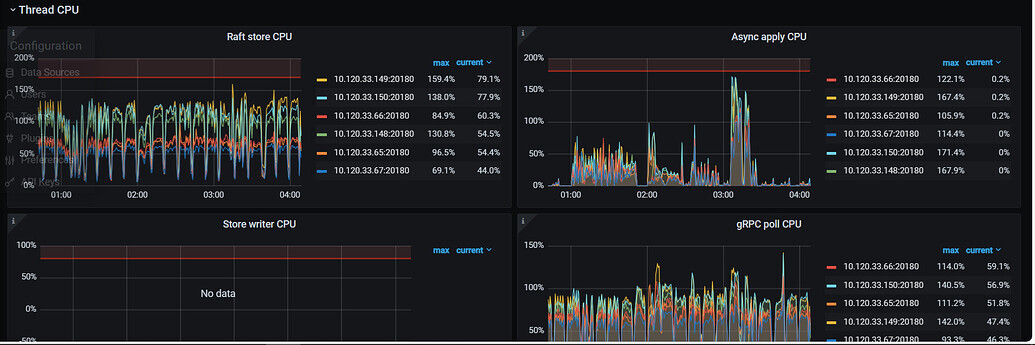
Additionally, in a high-load production environment, this situation is also quite noticeable, and there is a significant difference in raftstore CPU usage among the six KV nodes.
Similar to heartbeat messages.
Because the load is too low, even a small scheduled task becomes very noticeable?
Do heartbeat messages consume so many resources?
In our production environment, under load, this phenomenon is quite noticeable. The default number of raft store threads is 2, which seems to be almost maxed out. Additionally, we currently have 6 KV nodes, and the number of regions is basically evenly distributed, but why does the raft store usage exceed by more than double?
Because the load is too low?
We have adjusted the following problem description. We also encounter this situation in production, but the same issue still occurs.
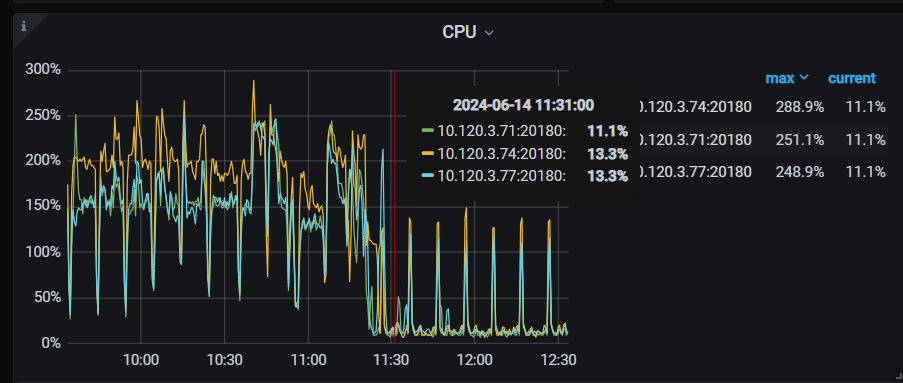
It’s clearly abnormal for your CPU to consume 2 cores. 200%.
Yes, it’s very strange. I remember this situation only appeared after I upgraded from 4 to 6.5, but I always felt there was no problem. Recently, I needed to do performance tuning, so I started paying attention to this.
Take a look at the kv_request panel. Also, how many regions does your current TiKV instance have?
Hibernate region is generally used for very large data scales (over 500T) because PD manages region information as a single point, and it has reached the resource bottleneck of PD, so it needs to be enabled.
Looking at your cluster, it doesn’t seem to fall under this issue. Enabling hibernate region might be for optimization, but it seems like the direction is not quite right and has introduced some additional bugs.
If it’s for optimization, it’s better to directly address the problematic points rather than getting entangled with the hibernate region issue.
Testing the previous KV had less than 20,000 regions.
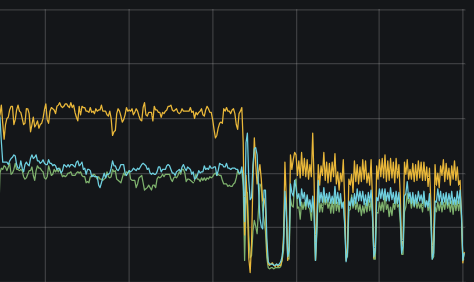
After disabling the hibernate region, the KV load remains at a high level similar to when the hibernate region is enabled. Essentially, it’s like the situation shown in the image below. It’s not necessarily entangled with the hibernate region; it’s just that this configuration item seems to affect the current state.
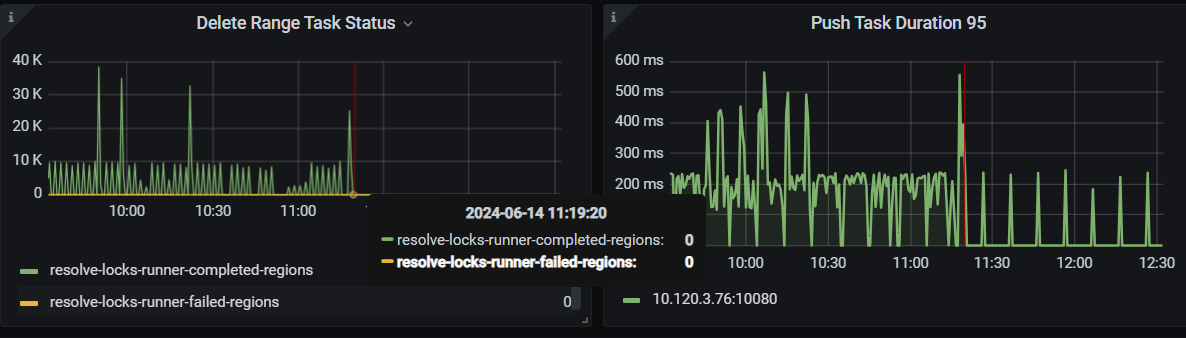
Could it be caused by GC? However, I found another situation: even when tidb_gc_enable is set to false, TiDB still performs GC operations, but the GC safe point no longer advances. In the case where GC is not enabled, are operations like resolve lock and delete range still necessary? Why is the interval for resolve lock so short?
This question is quite in-depth. We need to see which tasks will be executed automatically. It feels like heartbeat, GC, and others are all possible.
I just upgraded from 6.5.0 to 6.5.9, and the problem is gone… The new version of the monitoring matches the description of GC.
txn: unexpected high frequency gc · Issue #40759 · pingcap/tidb (github.com)