Note:
This topic has been translated from a Chinese forum by GPT and might contain errors.
Original topic: ‘Lost connection to MySQL server during query’ 链接丢失问题
[TiDB Usage Environment] Production Environment
[TiDB Version] v6.5.2
[Reproduction Path] Operations performed that led to the issue
[Encountered Issue: Problem Phenomenon and Impact]
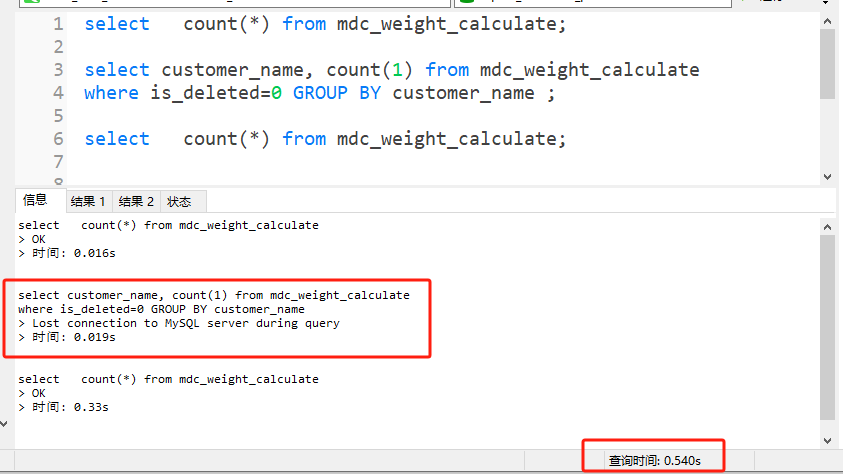
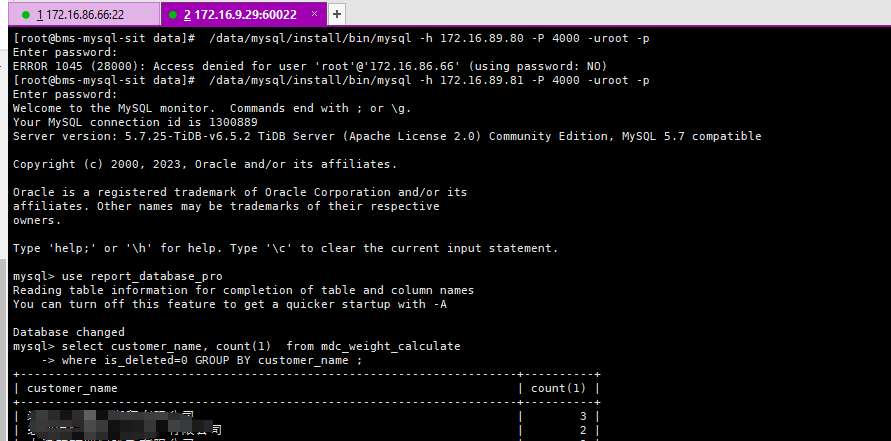
count() returns normal results, 492 records
Group query and two count() executed together take 0.5 seconds, group query reports an error after 0.02 seconds: > Lost connection to MySQL server during query
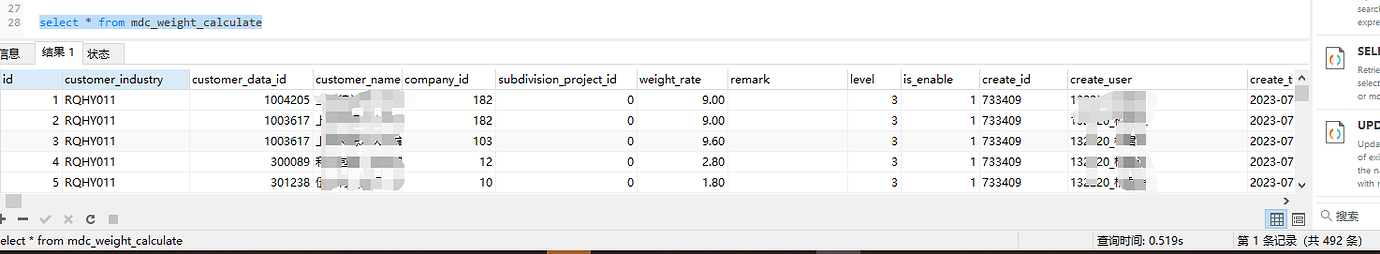
select * executes normally, taking 0.5 seconds
[Resource Configuration]
[Attachments: Screenshots/Logs/Monitoring]
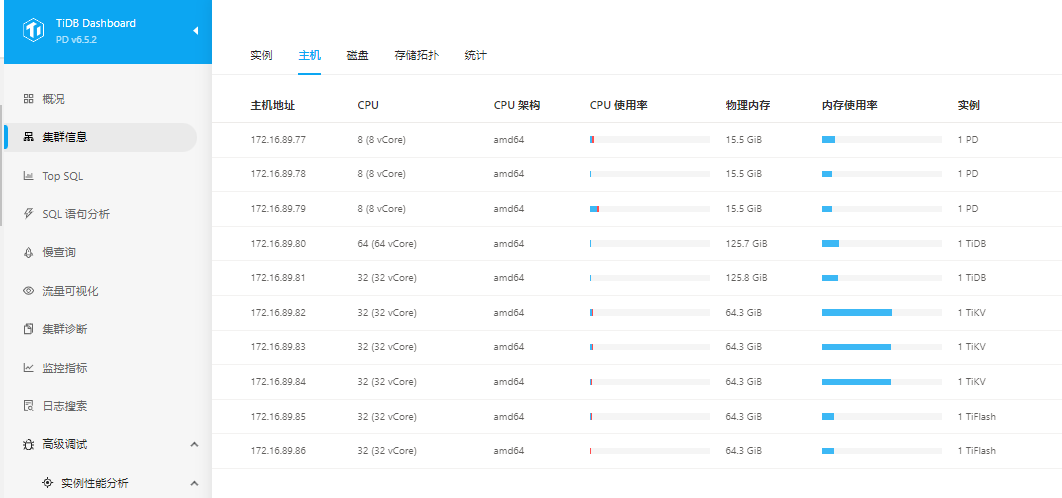
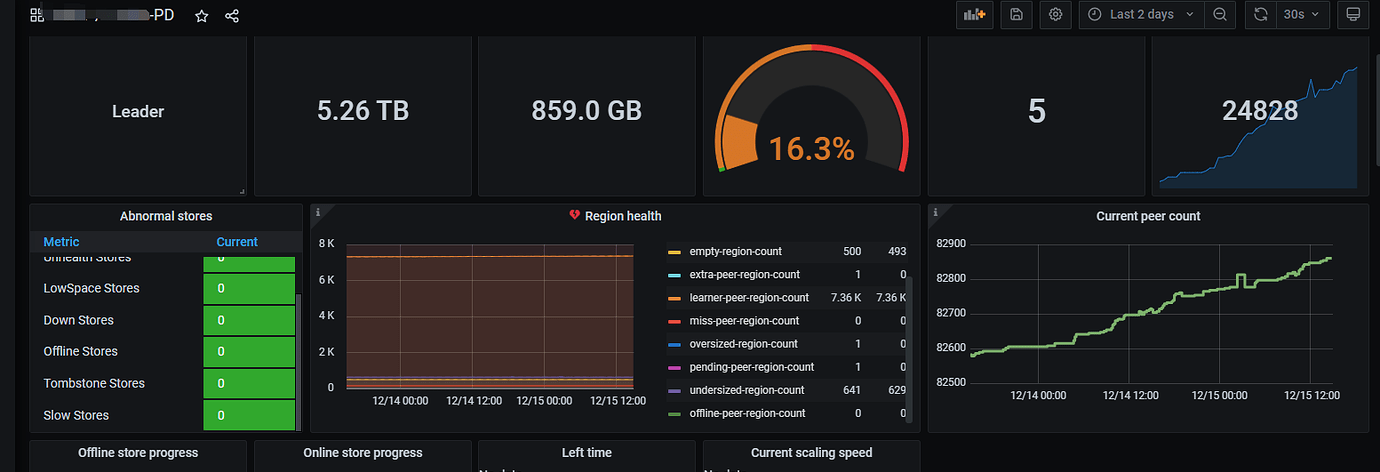
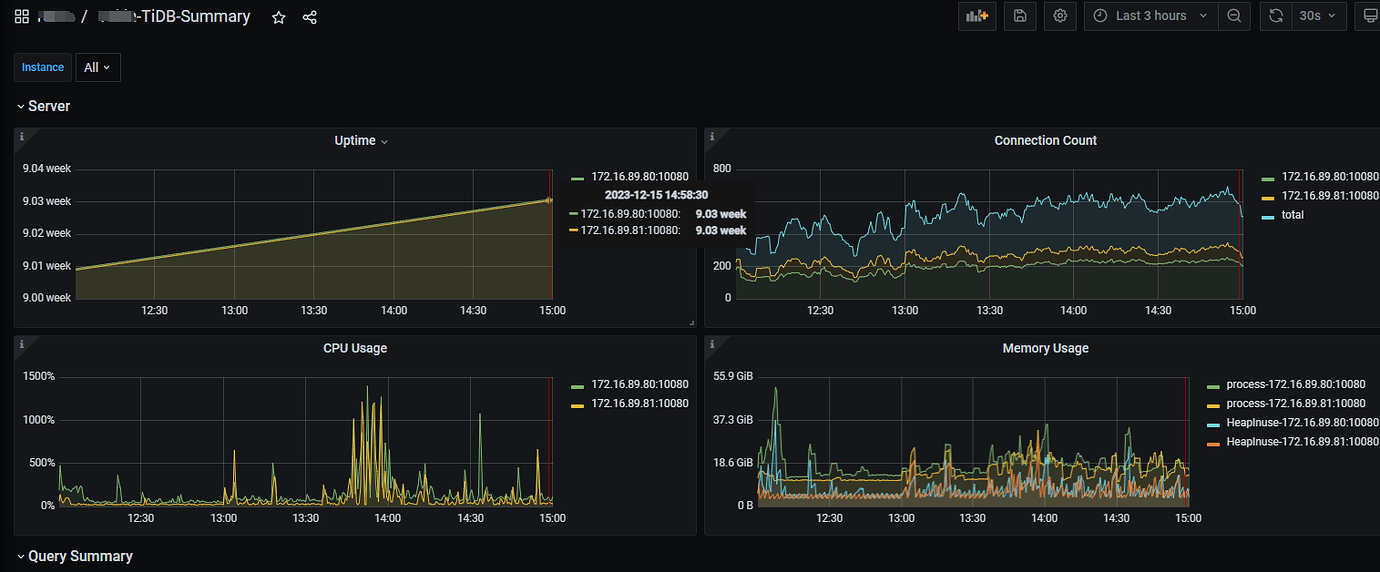
PD: Node status is normal
No OOM occurred on TiDB Server
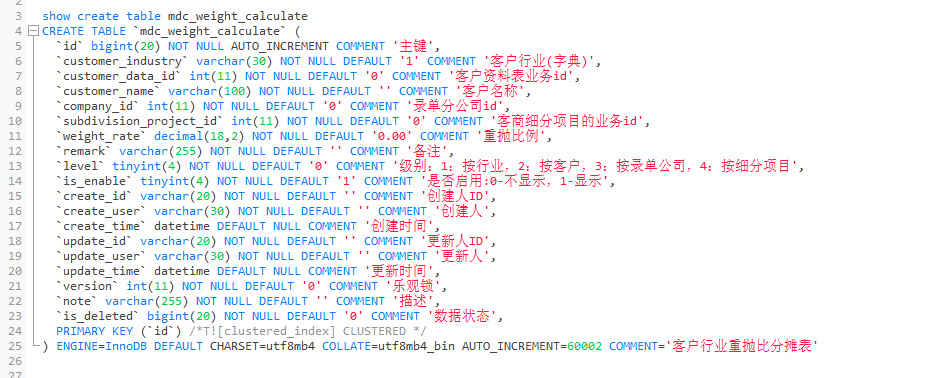
Table structure
Check if there are any error messages in the TiDB logs.
Can you check the logs for the corresponding time?
It has nothing to do with resources; it feels like a bug. If it’s a test environment, it is recommended to upgrade to 6.5.6.
Using the MySQL client to log in to the TiDB Server, the query works normally.
It probably OOMed during that time.
No OOM occurred, and no error information was found in the logs.
During execution, there is no information output in the tidb_stderr.log and tidb.log files.
Set up a test environment cluster using version 6.5.6, import only this table’s data, run this SQL statement, and test it. The test cluster’s resource configuration can be a bit lower.
Are you using HAProxy as a proxy to connect to TiDB? If so, configure it with send-proxy.
oom, the operating system message log will have a record, check this file.
Not using a proxy, directly connected with IP+port.
Other tables are normal, background execution is normal; the test environment is TiDB-v6.5.0, and execution is also normal.
Check if the connections in the TiDB server in Grafana are full?
The connection is normal, and the count(*) executed together with Navicat was also successful.
We once experienced that new connections would take a long time to establish, but once connected, executing SQL was very smooth. In the end, we resolved it by restarting. 
Restart the entire cluster?
Yes, but we are in a development environment, so we usually try restarting first.
Generally, once connected, unless there is a failure with the tidb-server or an execution timeout, this error usually won’t occur. You can check the logs in the dashboard to trace this statement.