Note:
This topic has been translated from a Chinese forum by GPT and might contain errors.
Original topic: 两节点cdc 内存使用极不均匀
[TiDB Usage Environment] Production Environment
[TiDB Version] 5.0.4
[Encountered Problem: Phenomenon and Impact]
The cluster has two CDC nodes, and the memory usage between the two nodes is extremely uneven.
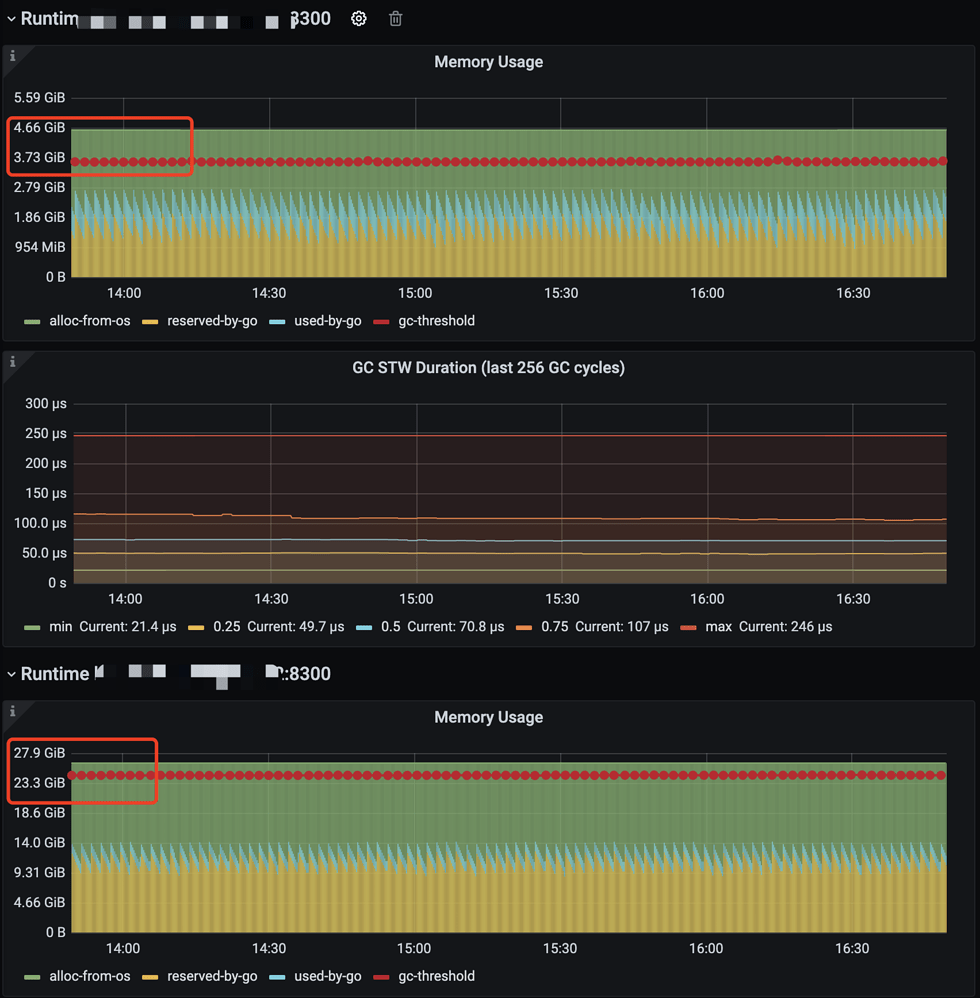
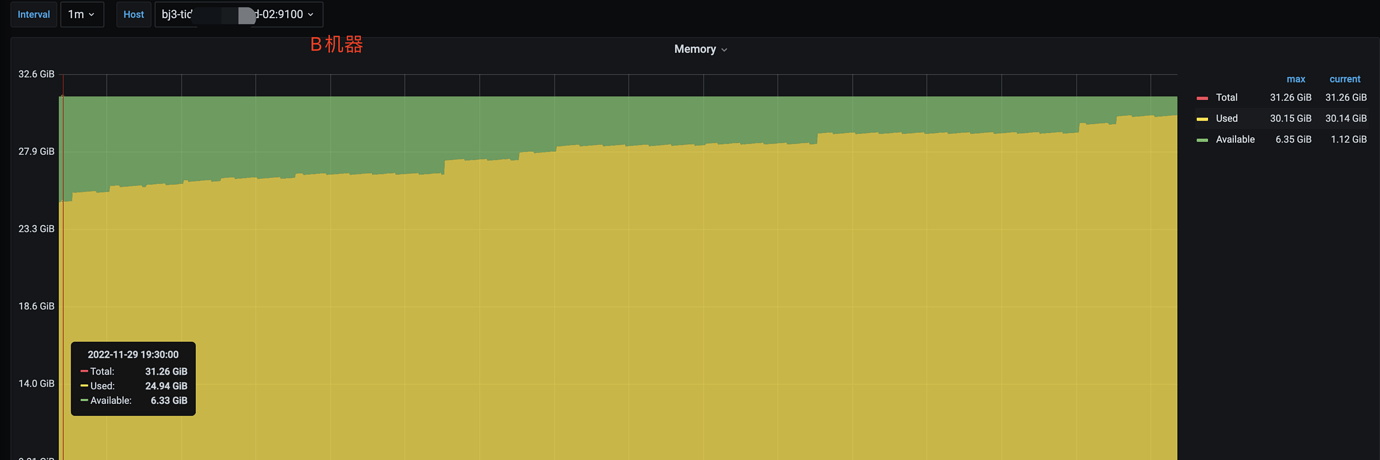
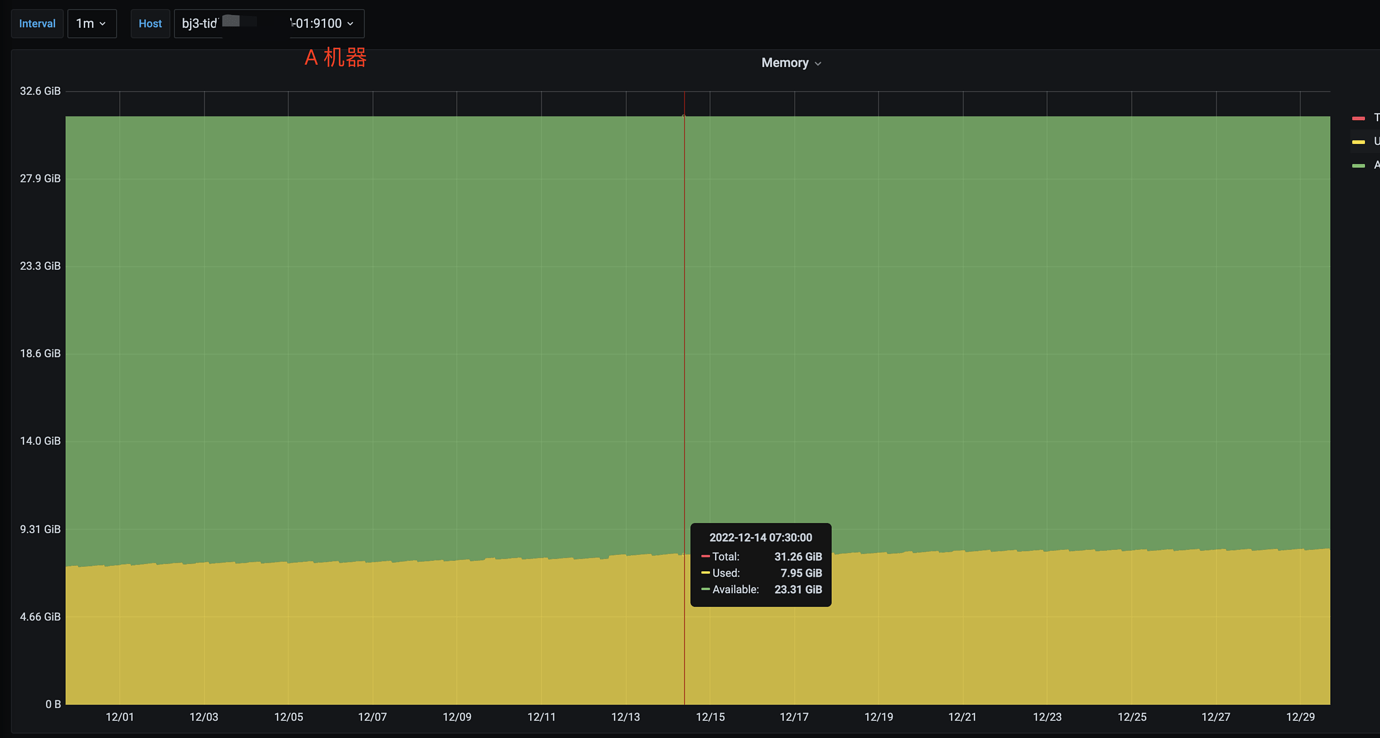
Respectively A=25%, B=92%
[Attachments: Screenshots/Logs/Monitoring]
Has it always been like this?
Yes, the memory usage of machine B has always been relatively high, and it has now reached 92%.
Regarding the above questions, please confirm the following information:
- Is the current CDC server deployed on a dedicated server or a mixed deployment?
- Is the downstream of CDC Kafka, MySQL, or TiDB?
- According to production environment requirements, TiCDC needs more than 64 GB of memory.
[changefeed.go:695] [“apply job”] [job=“ID:23497, Type:add column, State:done, SchemaState:public, SchemaID:14812, TableID:14840, RowCount:0, ArgLen:0, start time: 2022-12-27 14:45:48.199 +0800 CST, Err:, ErrCount:0, SnapshotVersion:0”]
- The CDC machine is a dedicated machine, purchased as a cloud service ECS machine, configured with 8 cores and 32GB of RAM.
- The downstream of CDC is Kafka.
Logs:
The table names have been anonymized, and the DDL with ErrCount:0
cdc_no_ddl_no_create_no_Err.log.tar.gz (5.9 MB)
Are the two CDC nodes the same size in terms of memory? Then the actual memory usage is unbalanced.
If the duration is relatively long, you can check the service processes or business to see which services are using this node.
Yes, the memory is the same.
For nodes with high memory usage (Node B), is there a corresponding synchronization task with a table that has a particularly large amount of changed data?
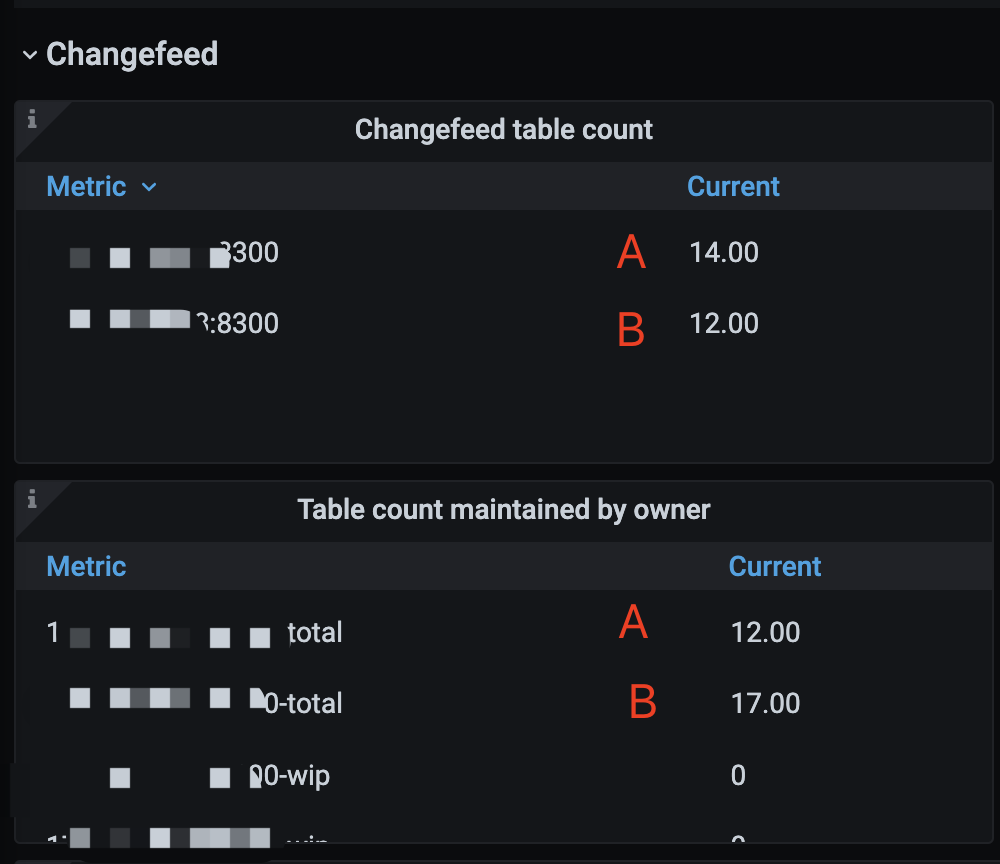
The current cluster has a total of 11 changefeeds distributed as follows:
Node A: 2 (these two changefeeds are also on Node B)
Node B (owner): 11 (all changefeeds)
The amount of changed data has not been counted yet.
It might be related to this. The node where the changefeed of the table with frequent data changes is located will definitely consume less memory than the one with infrequent changes. Check it out and see if the tables managed by the changefeed on the two nodes include hot tables. If so, check if there are differences in the hot tables (number, frequency of data changes). Try to balance them as much as possible.
Hmm, I didn’t find any official command for scheduling changefeed sub-tasks. @Billmay
After removing a few changefeeds, the memory usage has decreased.
The root cause initially appears to be the uneven scheduling of the changefeed task, leading to uneven system resource utilization.
You can create changefeeds based on the popularity of the tables, using the table filtering feature to ensure that each changefeed is responsible for a balanced number of tables as much as possible.
Is there a way to specify which capture a changefeed should be scheduled on based on table heat? I couldn’t find this command~
You can check the content introduction here.
First method:
Recreate the synchronization task based on table popularity.
Second method:
1. Pause changefeed;
2. Modify the configuration file (change the table filtering rules based on table popularity);
3. Update changefeed;
4. Resume changefeed;
The commands for versions 5.0 and 6.5 seem to be different. In 5.0, you specify the PD node, while in 6.5, you specify the --server. What are the differences in these changes?
cdc cli changefeed create --pd=http://10.0.10.25:2379 --sink-uri="mysql://root:123456@127.0.0.1:3306/" --changefeed-id="simple-replication-task" --sort-engine="unified"
cdc cli changefeed create --server=http://10.0.10.25:8300 --sink-uri="mysql://root:123456@127.0.0.1:3306/" --changefeed-id="simple-replication-task"