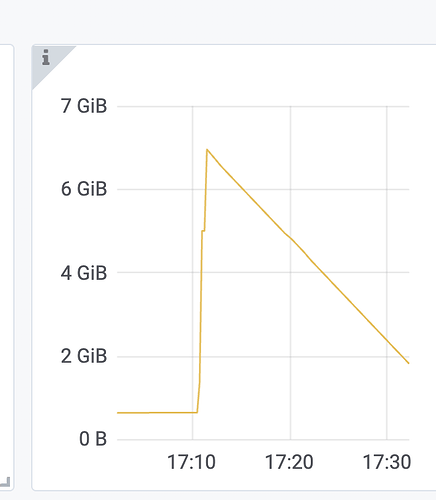
Monitoring (Prometheus, Grafana) shows the memory usage of the entire instance, which includes the actual memory used and objects that have not yet been garbage collected. This data is provided at the Go language level and is an accurate representation of memory overhead.
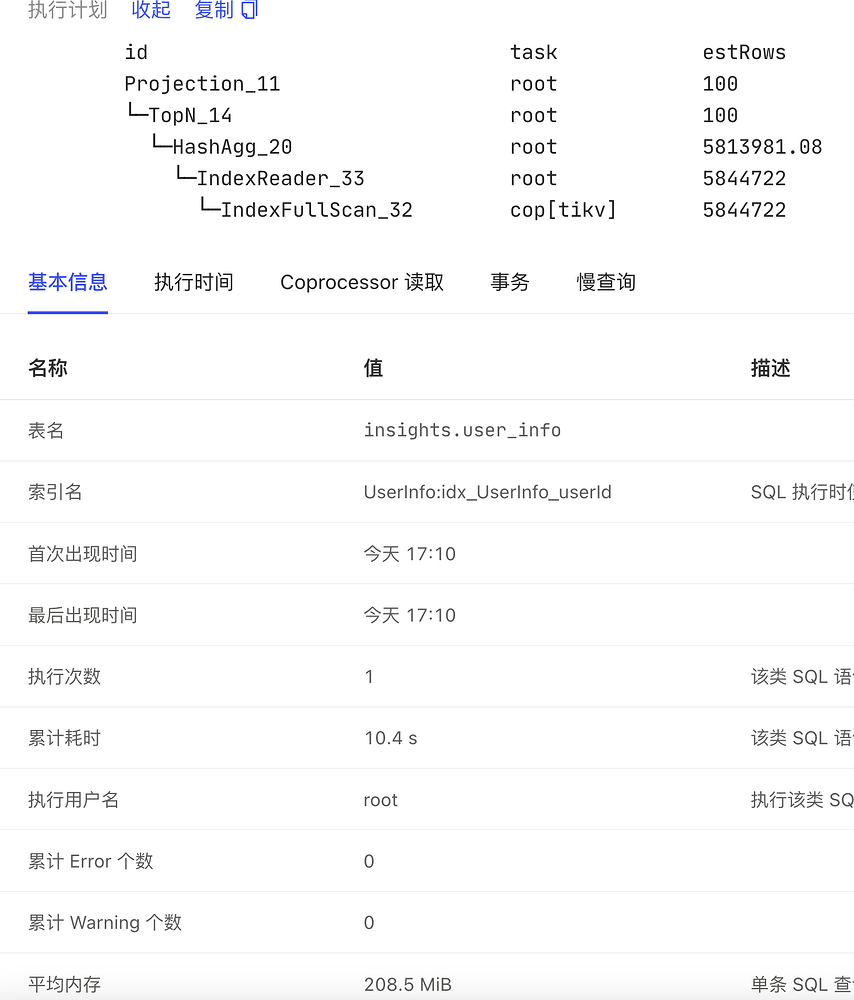
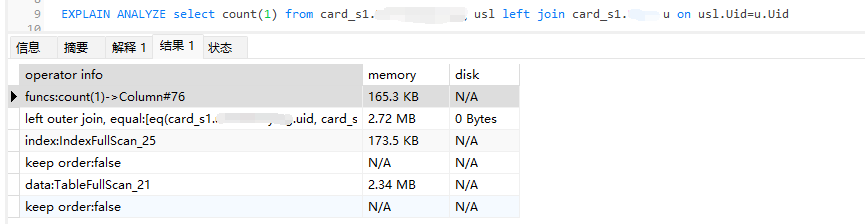
The memory usage in slow logs and information_schema.processlist is estimated by TiDB based on the number of records, which can be “relatively accurate.” However, there are some issues: 1) The memory usage of some records (such as chunks) may not be very accurate, but it is generally reliable; 2) Some memory overheads might not be accounted for, although newer versions have more comprehensive memory statistics; 3) Objects that are “destroyed” cannot be accounted for, but they still occupy memory until garbage collection occurs.
The calculation logic for SQL memory usage (as seen in show processlist or slow logs) is quite complex and is mainly tracked through memory tracking:
What is Memory Tracking
TiDB-server introduces a memory tracking framework to monitor memory usage during the execution of each statement in a connection. This helps trigger OOM actions when a statement consumes too much memory, thereby protecting the overall resource availability of the instance.
The smallest unit of memory tracking is a tracker, which is inserted at various stages of statement execution. A hierarchical tree is formed based on statement → operator → data processing within the operator. Each memory usage during data processing is recorded in the tracker and accumulated in the parent tracker, eventually summing up to the root tracker. This forms a memory tracking tree.
The memory obtained by the root tracker here is the memory usage of the statement you see in the slow log.
Implementation of Memory Tracking
The core structure for memory tracking is the Tracker:
type Tracker struct {
   bytesLimit           atomic.Value
   actionMuForHardLimit actionMu
   actionMuForSoftLimit actionMu
   mu                   struct {
      children map[int][]*Tracker
      sync.Mutex
   }
   parMu struct {
      parent *Tracker
      sync.Mutex
   }
   label int
   bytesConsumed       int64
   bytesReleased       int64
   maxConsumed         atomicutil.Int64
   SessionID           uint64
   NeedKill            atomic.Bool
   NeedKillReceived    sync.Once
   IsRootTrackerOfSess bool
   isGlobal            bool
}
Important attributes include:
- actionMuForHardLimit: Implements the ActionOnExceed interface for hard limit actions. When memory usage (bytesConsumed) reaches the hard limit, it triggers the OOM action. The hard limit is set by the tidb_mem_quota_query parameter.
- actionMuForSoftLimit: Implements the ActionOnExceed interface for soft limit actions. When memory usage (bytesConsumed) reaches the soft limit, it triggers the OOM action. The soft limit is 0.8 * tidb_mem_quota_query. Currently, the only soft limit action is the hashAgg operator spilling to disk; others are hard limit actions.
- bytesConsumed: The current memory tracked by this tracker, reported to the parent node. The root node contains the total memory used by the statement. If it exceeds the tidb_mem_quota_query, it triggers the OOM action.
- maxConsumed: The maximum memory ever used, mainly for displaying the maximum memory consumption of the current operator in the processlist.
- mu: Records the parent node’s tracker to form the tracking tree.
The most important method of this structure is Consume(bs int64), which adds the memory consumption bs to bytesConsumed. When bs is positive, it indicates memory consumption (e.g., reading chunk data from disk into memory). When bs is negative, it indicates memory release (e.g., writing temporary files from memory to disk). The core logic is as follows:
- Recursively call the getParent() method through the current tracker, accumulating the current memory consumption value (tracker.bytesConsumed) to the parent node.
- For each tracker in the hierarchy, if the accumulated tracker.bytesConsumed exceeds tracker.maxConsumed, set tracker.maxConsumed to tracker.bytesConsumed.
- After the loop, find the rootTracker (the top-level tracker of the current session). If rootTracker’s bytesConsumed exceeds the hard limit, record rootExceed (=rootTracker). If rootTracker’s bytesConsumed exceeds the soft limit, record rootExceedForSoftLimit (=rootTracker).
- If the instance’s memory usage exceeds tidb_server_memory_limit, kill the statement occupying the most memory. Check if the current rootTracker is already marked for execution; if so, trigger the Cancel action.
- If rootExceed exists, it means the statement’s memory exceeds the limit, triggering the hard limit OOM action.
- If rootExceedForSoftLimit exists, it means the statement’s memory exceeds 0.8 of the limit, triggering the soft limit OOM action.
Thus, by continuously calling the Consume() method to record current memory consumption, memory usage for operators and statements is tracked, and OOM actions are triggered accordingly.