Note:
This topic has been translated from a Chinese forum by GPT and might contain errors.
Original topic: TIDB pod的内存持续陡增
【TiDB Usage Environment】Production Environment
【TiDB Version】v6.1.1
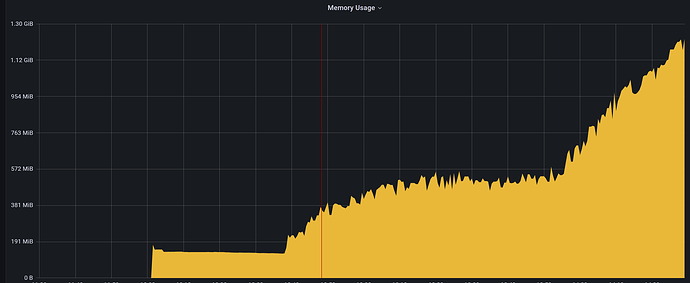
【Encountered Problem】After upgrading the cluster to 6.1.1, the memory usage of the tidb pod continues to increase
The log of the tidb pod:
tidb-cluster-tidb-0_tidb.log (415.1 KB)
Use curl -G tidb_ip:port/debug/pprof/heap > heap.profile to capture the memory and check the change in the number of goroutines in TiDB monitoring before and after the upgrade.
I couldn’t find the goroutine metrics in the TiDB monitoring.
tidb → server → goroutine count
Please redo the profile, I’m getting an error when I open it.
The high memory usage observed in the heap is related to the execution plan, but the amount shown in the profile doesn’t match the actual usage of over 1GB.
When exporting this file, the pod had already restarted, and it was using around 700M of memory at that time.
First, analyze and check the slow SQL, and see if there are any SQL statements with multiple execution plans. Try turning off the parameter tidb_enable_prepared_plan_cache.
Sort the full SQL in the dashboard by memory usage.
After I upgraded the monitoring, this metric appeared.
It’s not possible to compare this with the pre-upgrade state. Additionally, as mentioned earlier, try optimizing the slow SQL first. Try disabling the Plan cache to see if memory usage can be reduced, and check if it stops growing after reaching a certain size. It’s possible that some features and functionalities in the new version require more base memory than the previous version.
These are the top few after sorting in descending order.
The plan cache has been disabled, and the growth is relatively slow compared to before. The part of the graph where the memory increases slowly is the effect after disabling it.
Can these SQL statements be further optimized? They seem to be the same to me.
The execution plan and details of the SQL, what is the concurrency of this SQL?
The concurrency is not high, sometimes the query is executed every few minutes, sometimes once an hour.
From a business perspective, is it necessary to use a left join?
