Note:
This topic has been translated from a Chinese forum by GPT and might contain errors.
Original topic: miss-peer-region-count不下降
[TiDB Usage Environment] Production Environment
[TiDB Version] v6.5
[Encountered Issue: Phenomenon and Impact]
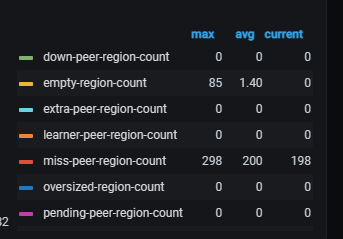
The cluster suddenly has many miss-peer-region-count.
It was found that the number of regions on each node is balanced.
[Resource Configuration]
3 KV nodes, 3 PD nodes, 3 TiDB-server nodes
[Attachments: Screenshots/Logs/Monitoring]
Please advise, experts.
Check the status of each TiKV.
The status of the KV is all normal.
There should be no disk errors.
How can I check the scheduling information?
pd log:
[WARN] [util.go:163] [“apply request took too long”] [took=157.598105ms] [expected-duration=100ms] [prefix="read-only range "] [request="key:"/topology/tidb/" range_end:"/topology/tidb0" "] [response=“range_response_count:6 size:1059”]
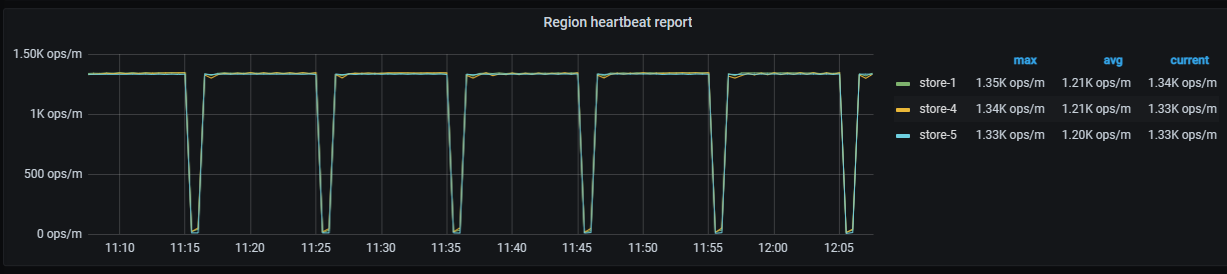
pd-heartbeat:
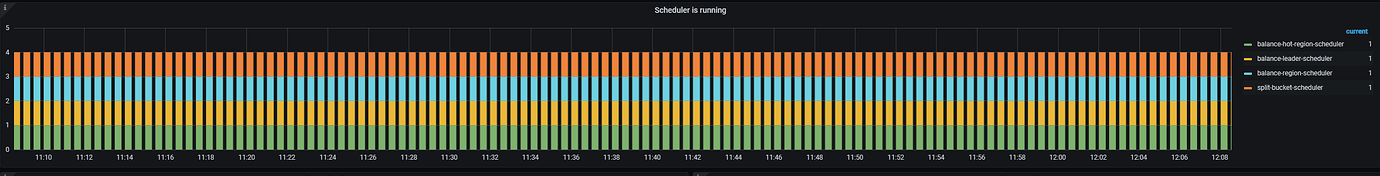
pd-scheduler:
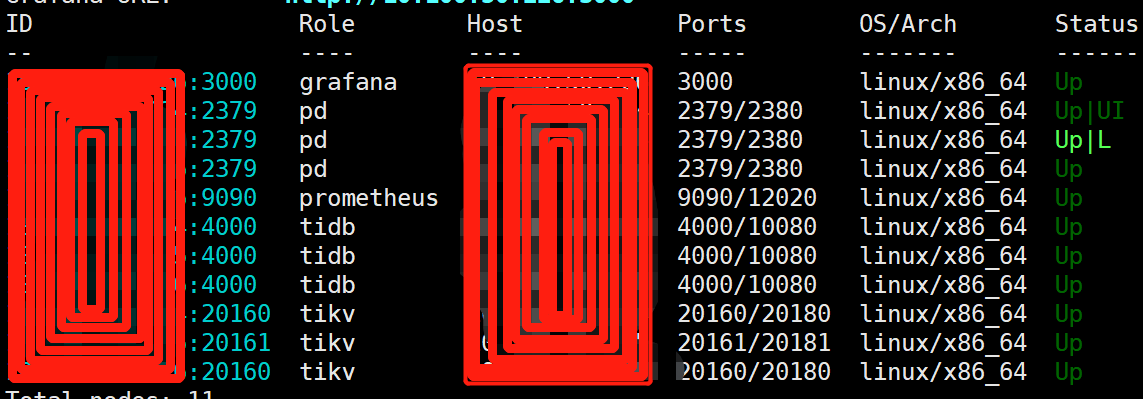
tiup cluster display:
Use pd-ctl region check miss-peer to see which regions are affected. Then use pd-ctl region xx to check the status.
Two ways to view the same region, “pending_peers” are different. Is this the problem?
The number of miss-peer in config show is very large, not sure how to count the specific number.
In addition to miss-peer, there are also many empty-region and undersized-region.
Check if the disk and CPU of TiKV are busy.
Check the TiKV detail – raft propose – apply monitoring latency.
The image you provided is not accessible. Please provide the text content that needs to be translated.
Is there a timeout error reported for PD scheduling?
Can you take a screenshot of the miss-region monitoring, from before the issue occurred to now?