Note:
This topic has been translated from a Chinese forum by GPT and might contain errors.
Original topic: 监控告警 TiDB monitor time_jump_back error
[TiDB Usage Environment] Production / Testing / PoC
[TiDB Version]
[Reproduction Path] What operations were performed when the issue occurred
[Encountered Issue: Issue Phenomenon and Impact]
[Resource Configuration] Go to TiDB Dashboard - Cluster Info - Hosts and take a screenshot of this page
[Attachments: Screenshots/Logs/Monitoring]
Received alert:
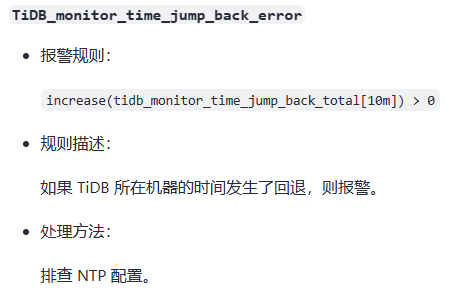
TiDB monitor time_jump_back error
Checked the official documentation:
The metric tidb_monitor_time_jump_back_total is obtained from the TiDB server’s status port http://10.10.10.10:10080/metrics
Question:
How is tidb_monitor_time_jump_back_total calculated?
How much time rollback difference will cause this value to change?
The “time jump back error” in the TiDB monitoring system usually indicates that the monitoring system has detected a time rollback in a component, meaning the timestamp of the monitoring data collected is earlier than the previous timestamp. This could be due to clock drift, time synchronization issues, or manual adjustments to the system time.
Solutions:
-
Check Server Time: Ensure that the time on all servers hosting TiDB components is accurate. You can use time synchronization services like ntpdate or chrony to calibrate the time.
-
Check for Clock Drift: If there is clock drift between servers, investigate and resolve the clock drift issue.
-
Review Logs: Check the log files of the relevant TiDB components for more detailed error information to help diagnose the problem.
-
Restart Services: If the time synchronization issue is temporary, restarting the relevant TiDB services might restore time synchronization.
-
Update Monitoring System Configuration: If the issue is with the monitoring system configuration, update the relevant configuration to ensure correct timestamp collection.