Note:
This topic has been translated from a Chinese forum by GPT and might contain errors.Original topic: 监控drainer 显示不全
[TiDB Usage Environment] Production Environment / Testing / PoC
[TiDB Version]
[Reproduction Path] What operations were performed when the issue occurred
[Encountered Issue: Issue Phenomenon and Impact]
[Resource Configuration]
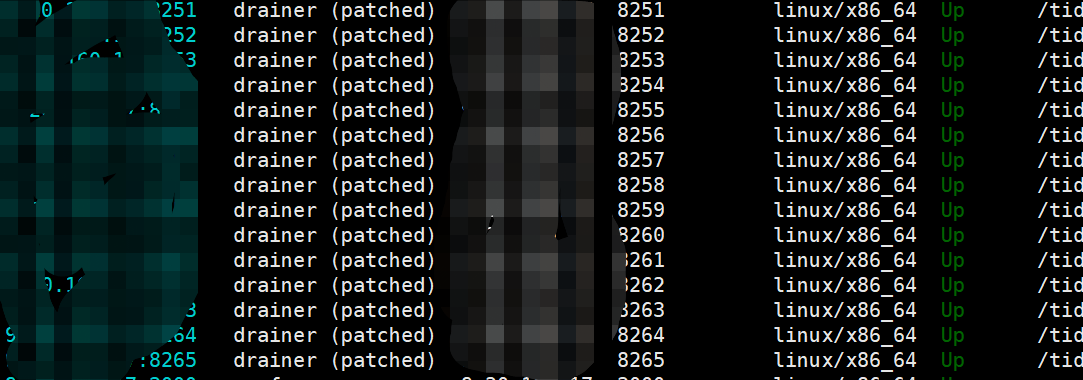
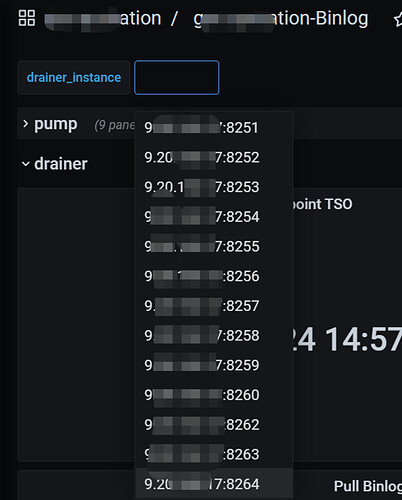
[Attachments: Screenshots/Logs/Monitoring] The cluster has a total of 15 drainer links in use, but 2 are missing from the monitoring panel.
Upon inspection, it was found that the mutual trust between the two servers was lost. After reconfiguring the mutual trust and restarting the monitoring and Prometheus, it returned to normal. I would like to ask, if the mutual trust between the two servers in the deployed cluster is lost, shouldn’t the cluster experience a down issue? Why were only two links missing? To add, all 15 drainers are on one server, and the pumps are on two servers, one on each.

