Note:
This topic has been translated from a Chinese forum by GPT and might contain errors.
Original topic: 监控发现ng-monitoring-server进程突然占用大量内存
[TiDB Usage Environment] Production Environment
[TiDB Version] v6.5.1
[Reproduction Path]
[Encountered Problem: Problem Phenomenon and Impact]
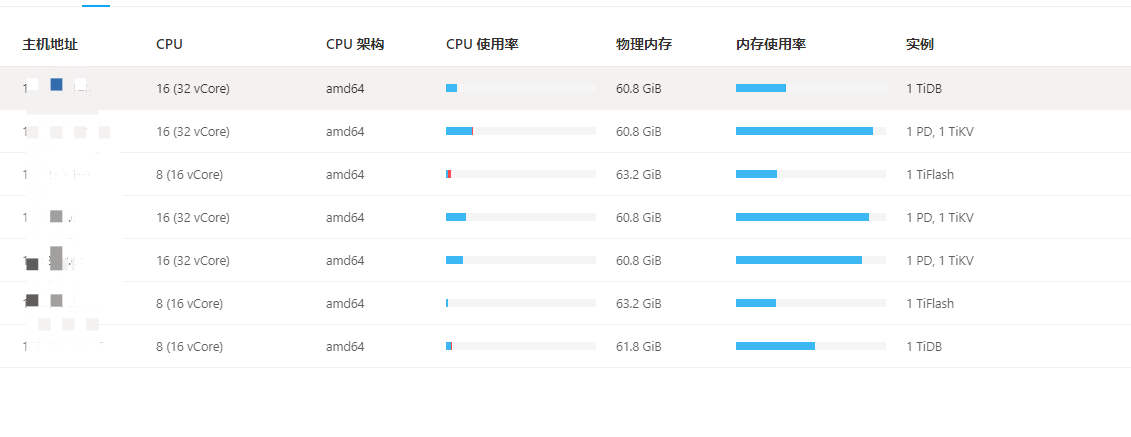
[Resource Configuration] Enter TiDB Dashboard - Cluster Info - Hosts and take a screenshot of this page
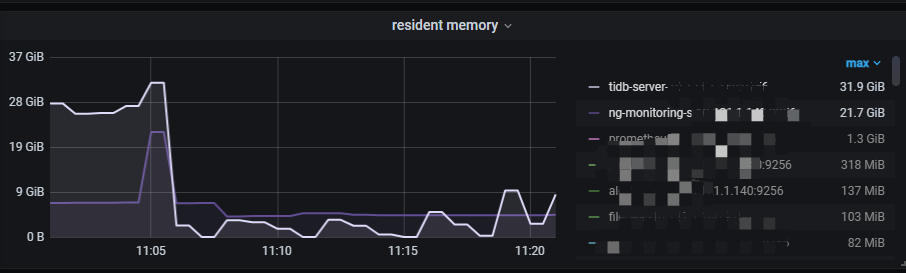
[Attachments: Screenshots/Logs/Monitoring]
Monitoring found that the ng-monitoring-server process suddenly occupied a large amount of memory. The logs do not show why. Under what circumstances would the ng-monitoring-server process occupy a large amount of memory?
It looks like the TOP SQL or performance analysis feature
You can try disabling SQL statement analysis in the Dashboard interface to see if it improves the situation.
If you analyze it, pay attention to the logs. To solve it, the reboot method usually works.
Check the configuration files of ng-monitoring-server and the monitoring system settings to ensure they are consistent with the recommended settings.
Analyze the monitoring data and logs of ng-monitoring-server to identify the root cause of the specific issue.
It’s a very scary event when the memory of ng-monitoring-server suddenly spikes. Are there any parameters to limit the memory of ng-monitoring-server?
You can collect flame graphs to take a look.