Note:
This topic has been translated from a Chinese forum by GPT and might contain errors.
Original topic: Navicat查询TIDB数据,查询结果返回后显示耗时很短,但是Navciat返回很慢
【TiDB Usage Environment】Production Environment
【TiDB Version】7.1.0
【Reproduction Path】Using Navicat for queries
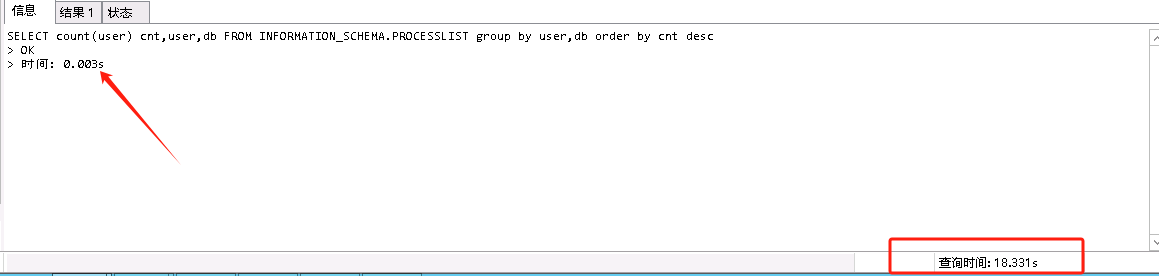
【Encountered Issue: Navicat querying TiDB data, the query result shows a very short duration, but Navicat returns very slowly】
【Issue Screenshot】
Total SQL execution time = client driver processing time + database SQL execution time + communication time
The displayed query time is the total SQL execution time.
It should be caused by Navicat itself, but it doesn’t matter. If you use code to execute the query operation, it might not take that long.
You can manually access the database without using Navicat to confirm whether it is a problem with Navicat.
You must learn how to import using the command line
mysql < 1.sql
The displayed time is the SQL execution time, and the time-consuming part is the transfer to the UI and the time taken to display on the UI.
Try bypassing HAProxy.
Or try using MySQL directly.
Additionally, Navicat’s licensing is very strict.
This is normal. We also noticed this when using Navicat. You just need to pay attention to the time taken for the query results to return.
It should be an issue with Navicat’s rendering time.
Try upgrading the version.
I have tested this issue and it has occurred before. The root cause is still machine imbalance, with queries falling onto a specific machine.
It has nothing to do with the Navicat tool.
For example, if it falls on a certain TiKV, a simple solution is to vertically upgrade the machine, such as upgrading the configuration of a certain machine.
How did it end up on that machine?
Just directly look at the Grafana monitoring to see which machine’s CPU is increasing rapidly.
Because the query session on the page and the session on Navicat fall on different TiDB machines, this issue can occur. We’ve encountered this problem many times.
Looking at your PD allocation, we randomly allocate anyway, so just upgrade all the configurations and the problem will be solved.