Note:
This topic has been translated from a Chinese forum by GPT and might contain errors.
Original topic: NgMonitoring
[TiDB Usage Environment] Production Environment / Testing / Poc
[TiDB Version]
[Reproduction Path] What operations were performed that led to the issue
[Encountered Issue: Issue Phenomenon and Impact]
[Resource Configuration]
[Attachments: Screenshots / Logs / Monitoring]
The speed is fast enough, 6.5 is already up and running 
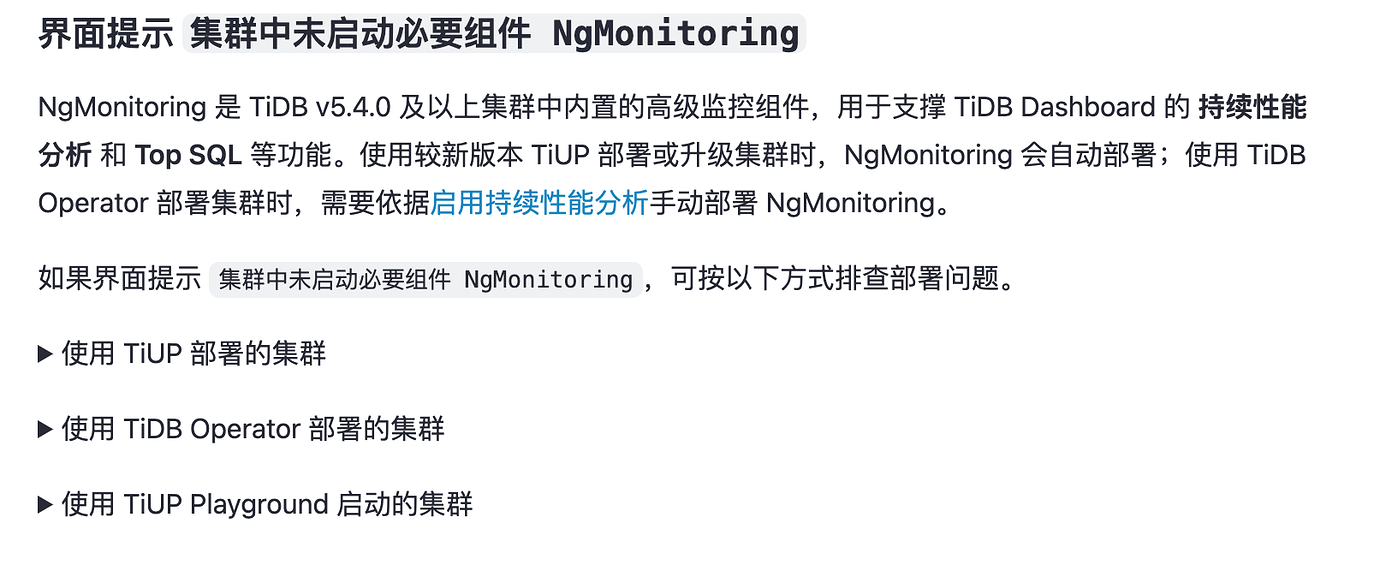
You didn’t deploy the monitoring components.
Could you provide more guidance and steps?
Tried it, still doesn’t work.
I have tried this method, but it still doesn’t work after deleting the directory and restarting the service.
Have you checked it according to the method in the screenshot?
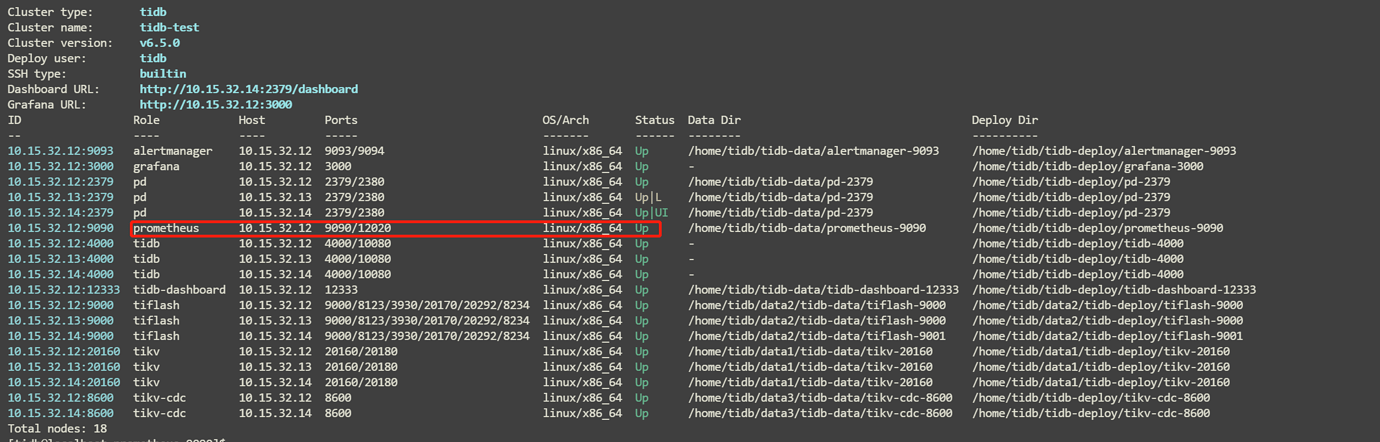
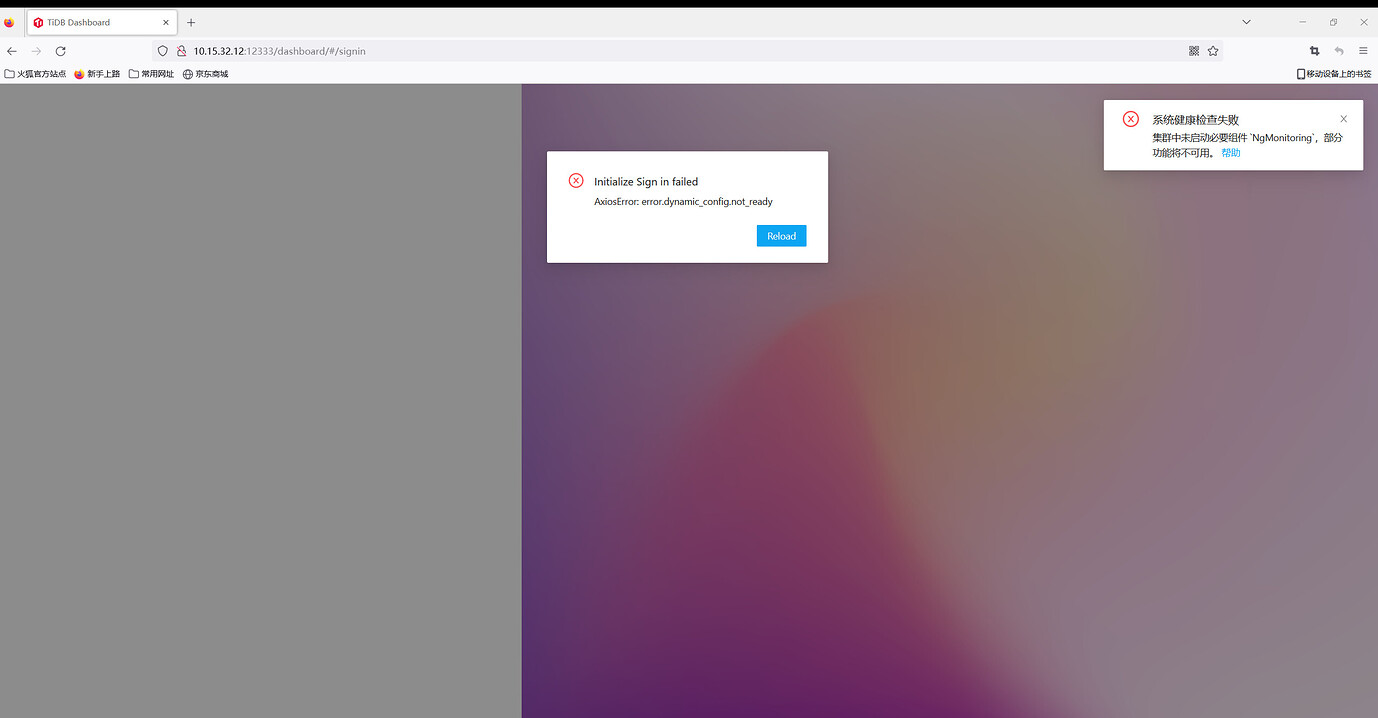
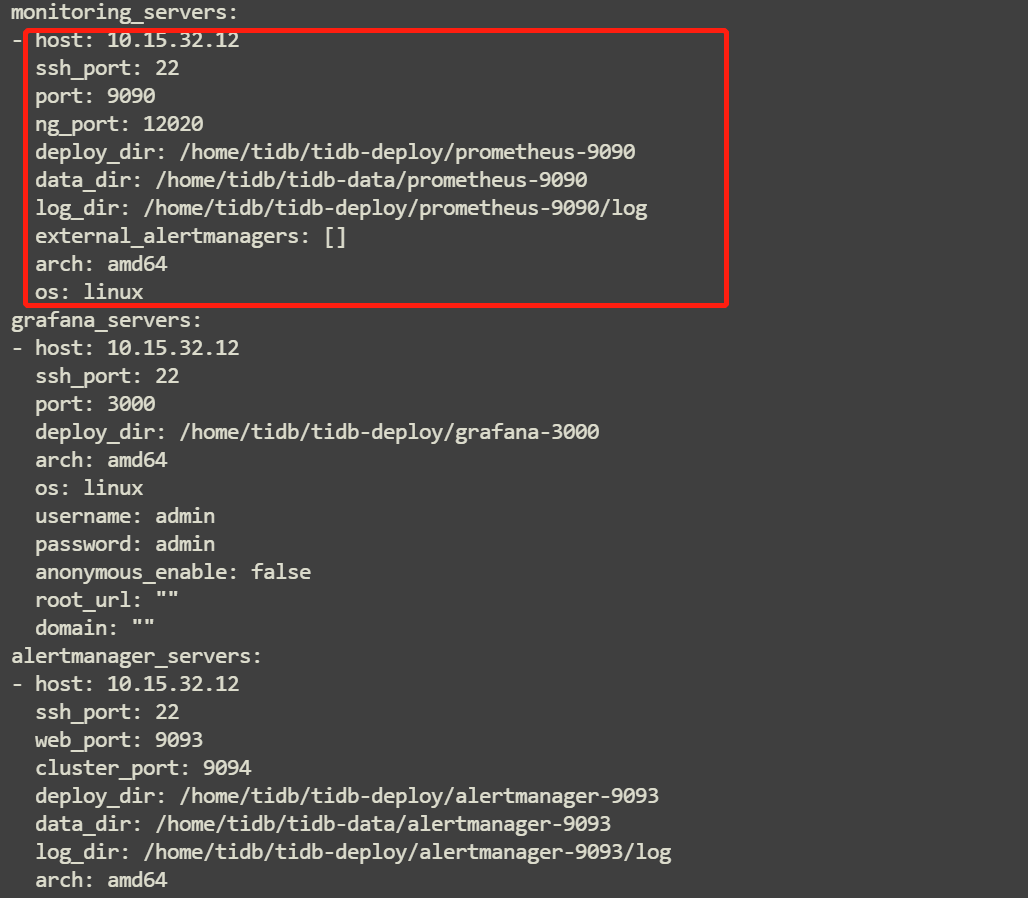
I tried it. I deployed the cluster using tiup. The cluster configuration file has the monitoring_servers configuration. Then I tried restarting the Prometheus node. After successfully restarting, logging into the dashboard still prompts: The necessary component NgMonitoring is not started in the cluster, some functions will be unavailable.
Added ng_port, please help me check if this configuration is correct.
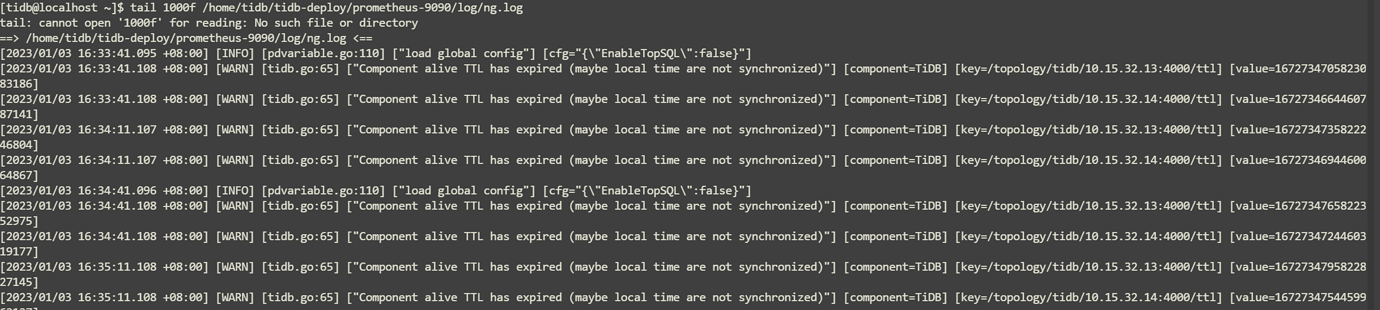
The configuration is fine, check the ng log to see what error it reports.
I am preparing to destroy it and reinstall a lower version.
Reinstalling version 6.1.0 worked without any issues. Thanks to the technical support lady from PingCAP, and thanks to everyone.
Sure~ Feel free to ask again if you have any questions~
The problem is not solved. Is there an issue with ngMonitor in TiDB 6.5? Why is it OK in version 6.1?
It shouldn’t be an issue with version 6.5. The reason is that I customized the dashboard node in the cluster topology file, but since version 4.0, the dashboard has already been integrated into PD.
May I ask: Is it that custom dashboards are not supported? Or is it because there are anomalies in the format or other aspects of the defined dashboard?
It should not support custom dashboards.