No data in Grafana after TiDB cluster deployment

Note:
This topic has been translated from a Chinese forum by GPT and might contain errors.

Original topic: tidb 集群部署后granfa 没有数据

| username: yangjingxing

[TiDB Usage Environment] Production Environment / Testing / PoC
[TiDB Version]
[Reproduction Path] What operations were performed when the issue occurred
[Encountered Issue: Problem Phenomenon and Impact]
[Resource Configuration] Go to TiDB Dashboard - Cluster Info - Hosts and take a screenshot of this page
[Attachments: Screenshots/Logs/Monitoring]


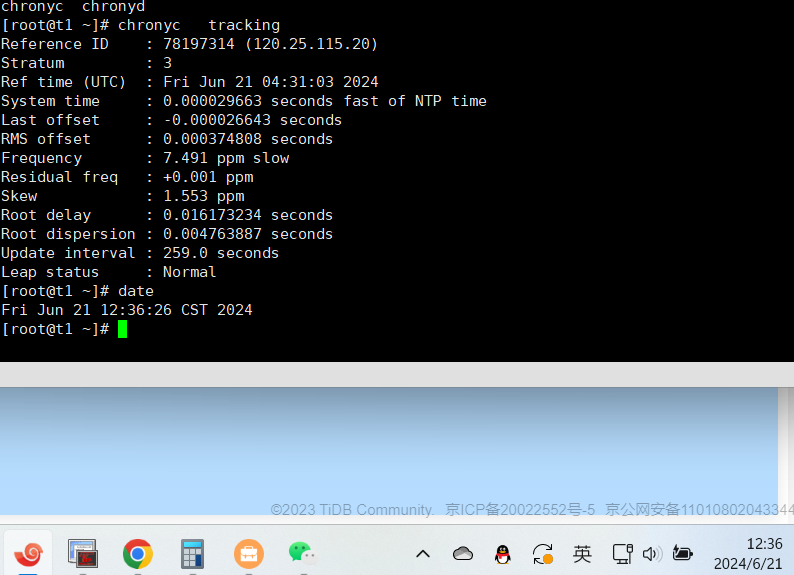
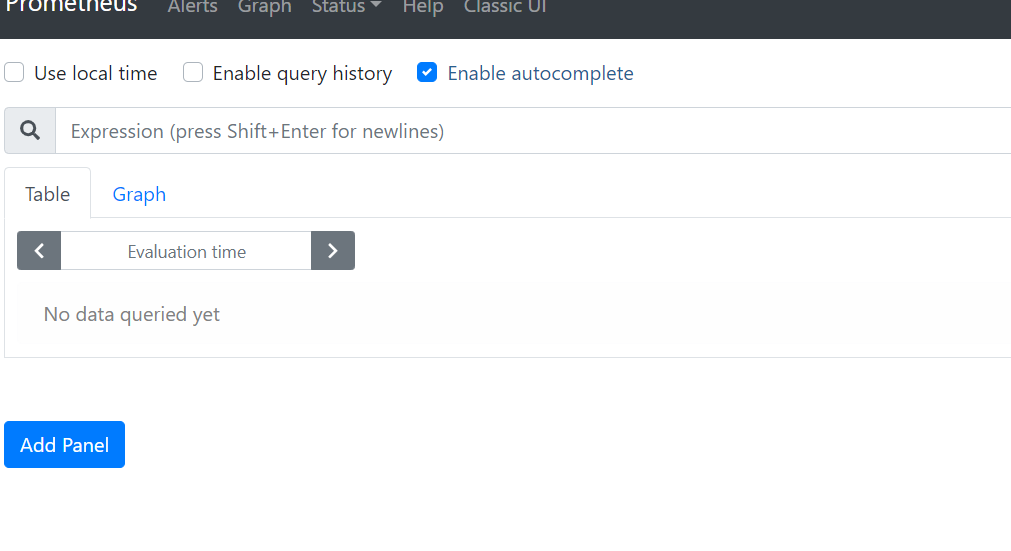
Time synchronization has been done, but there is no data in Prometheus. How should this be investigated?

| username: Jellybean | Original post link

You can check the running logs of Prometheus.

| username: xfworld | Original post link

What installation method did you use?

| username: yangjingxing | Original post link

tiup online installation

| username: xfworld | Original post link

Is the status of each node normal? Check the running logs to see if there are any error messages.

| username: zhaokede | Original post link

Do you have the runtime logs? Check if there are any errors in the runtime logs.