Note:
This topic has been translated from a Chinese forum by GPT and might contain errors.
Original topic: Tidb数据库偶尔延迟高,求排查方式
[TiDB Usage Environment] Production Environment
[TiDB Version] v5.4.0
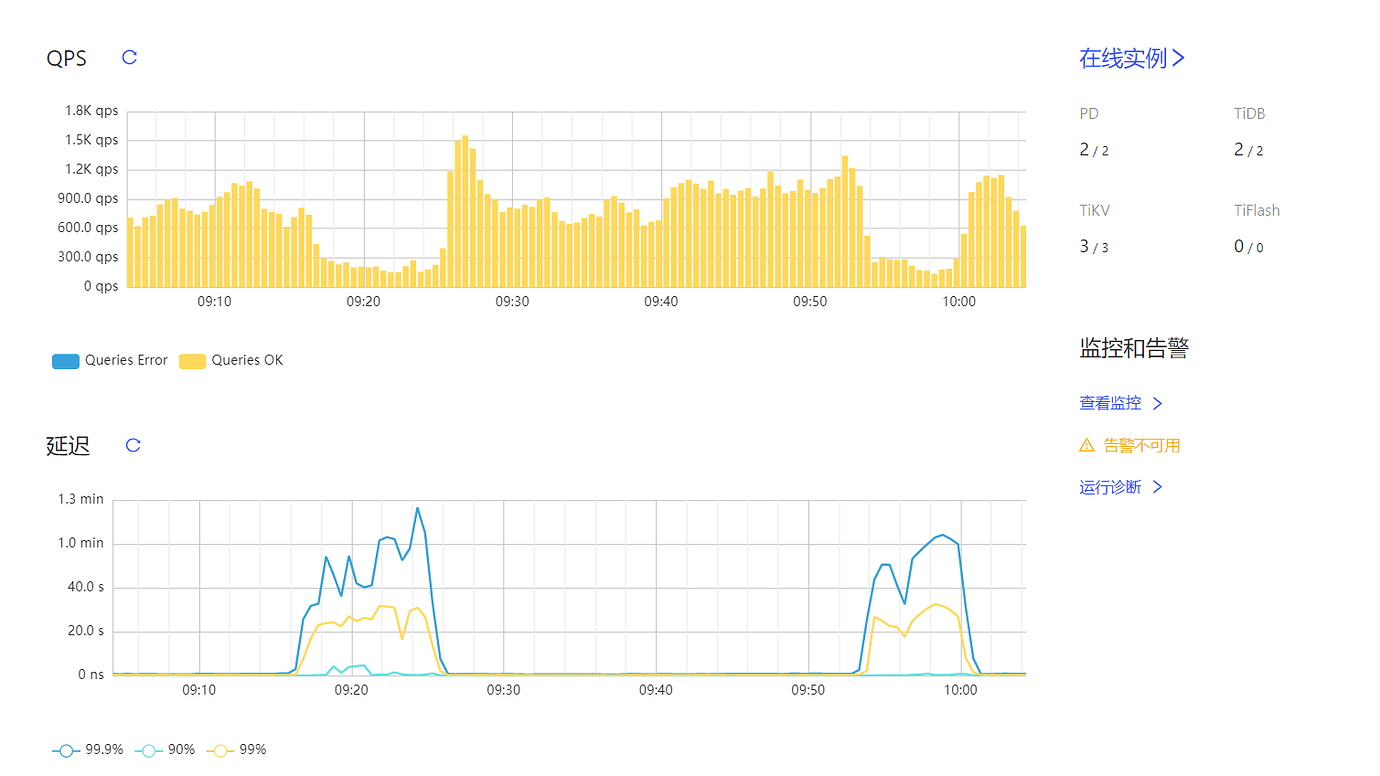
[Reproduction Path] The issue of high latency occurred several times around 9 o’clock, causing business stalling.
[Encountered Problem: Phenomenon and Impact]
[Resource Configuration] Go to TiDB Dashboard - Cluster Info - Hosts and take a screenshot of this page
[Attachments: Screenshots/Logs/Monitoring]
Take a look at the slow queries and resource consumption of these points.
For reproducible issues, you can first capture the output of SHOW PROCESSLIST, which often helps identify the problem.
It looks like there are quite a few full table scans causing hotspots. You can try optimizing slow SQL and creating indexes to solve this.
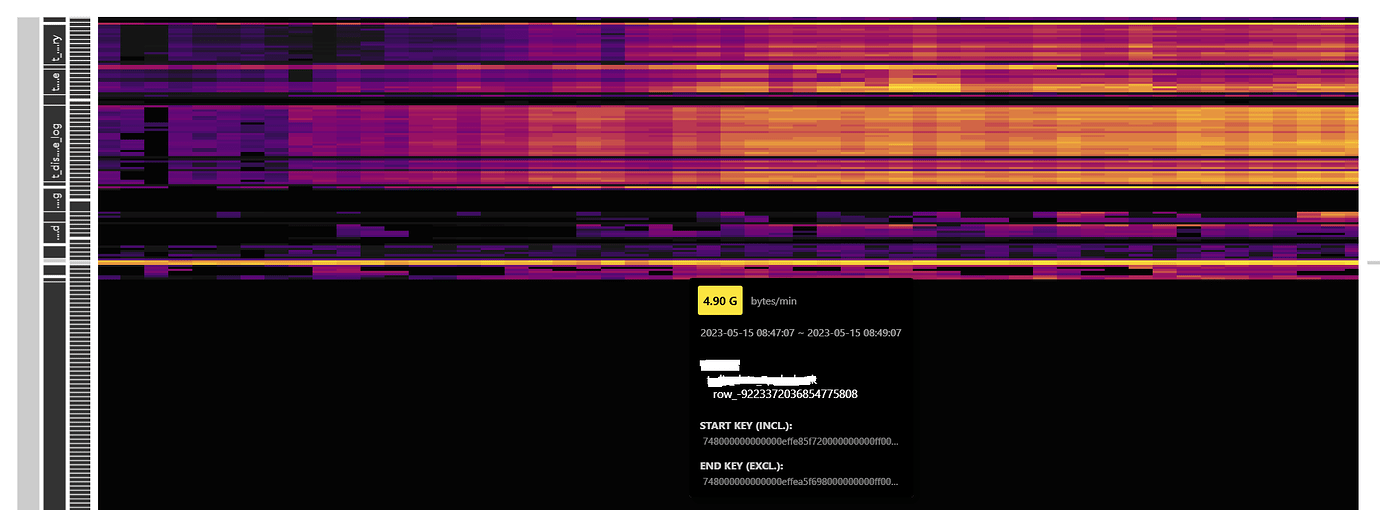
I see that the SQL query is slow due to TiKV’s IO latency, and it seems that it was executed on a single TiKV at that time. Is there a way to distribute the execution across three nodes?
From your heatmap, it is evident that there are hotspots. You need to find a way to disperse the hotspots in the queried table.
Download a diag by running tiup install diag, then collect the information around the specified time period and upload it to the clinic server. PingCAP Clinic 快速上手指南 | PingCAP 文档中心
Find the corresponding slow SQL at that time and identify where exactly it is slow.
Are there any methods to disperse hotspots?
Hotspot Investigation:
How to confirm it is a hotspot issue
Causes of hotspot issues
Solutions to hotspot issues
1. Causes and Principles of Hotspot Formation
-
Write: Data storage is organized in an ordered manner by key, and the key prefix of data in the same table is the same, leading to continuous writes on the same TiKV instance.
-
Read: High-frequency access to small tables, large-scale data scans, and scans of sequentially growing indexes.
2. How to Locate Hotspot Issues
-
Confirm the time and table regions through the traffic visualization heatmap in the Dashboard, then identify potential SQLs in the slow query SQL and SQL statement analysis pages.
-
Confirm through the TiKV trouble shooting page in Grafana, hot write/read in tikv-Details, and PD monitoring.
3. Solutions to Hotspot Issues
- Before business goes online, scatter hotspots in advance when creating tables:
-
When creating a table with a non-clustered index or a clustered index with a non-int primary key, use shard_row_id_bits and pre_split_regions to pre-allocate regions to avoid hotspots.
-
If creating a table with a clustered index and an auto-increment int primary key, use auto_random to specify random generation of tidb_rowid to scatter hotspots instead of auto_increment. The unique auto-increment primary key in TiDB only guarantees uniqueness and non-null properties, not increment properties.
-
If bulk data insertion follows bulk table creation, enable the tidb_scatter_region switch to automatically scatter regions after table creation.
- If hotspots are found during business operation:
-
If index hotspots are confirmed through the dashboard, manually split regions and let the system scatter them: split table {table_name} index {idx_name} between {from} and {to} regions {n}. If hotspots persist, manually scatter them. See below for steps.
-
If the table being written to has an auto-increment int primary key, set auto_random (alter table {table} modify a bigint auto_random(5)).
-
If the hotspot-causing SQL is an insert operation and the table has no primary key, set shard_row_id_bits to scatter the internally allocated tidb_rowid.
-
If the hotspot-causing SQL is an update/delete operation, manually scatter regions. Steps to manually scatter regions:
-
Confirm start_key through the dashboard, then find the region id and store id: pd-ctl region key {start_key}.
-
Split the region: pd-ctl operator add split-region {region_id} --policy=approximate.
-
Manually scatter:
-
Find the new region id after splitting from pd.log, then manually transfer it to an idle node. First, check which store is relatively idle and find its store id.
-
operator add add-peer {new-region-id} {target-store-id}.
-
operator add transfer-leader {new-region-id} {target-store-id}.
-
operator add remove-peer {new-region-id} {origin-store-id}.
-
If it is a read hotspot caused by frequent access to a small table:
-
If it is less than 64MB and not frequently updated, set it as a cache table to cache it directly in the tidb-server memory.
-
Trigger the system’s automatic scattering function to balance it by setting config tikv split.qps-threshold=3000 for QPS over 3k, or set config tikv split.byte-threshold=30 for access traffic over 30MB.
-
If it is a read hotspot and not a small table, it may be an execution plan issue. Confirm if there are missing indexes or if the optimizer has chosen the wrong index to handle it.
This afternoon, I optimized all the SQL queries. In the evening, I noticed that even when the business volume was low, the IO of TiKV still remained at 30%. Does this mean that the IO capacity of the TiKV server needs to be increased?
Analyze the slow SQL during this period.