Note:
This topic has been translated from a Chinese forum by GPT and might contain errors.
Original topic: tiup 离线安装提示 tidb-dashboard:v6.1.3 (linux/amd64) … Error
I followed this document to install it using the offline package: Using TiUP to Deploy a TiDB Cluster | PingCAP Docs.
1.11.1 tiup
I used tiup cluster template > topology.yaml and there is a section like this:
tidb_dashboard_servers:
# The IP address of the PD Server.
192.168.0.33 is not the PD address; 192.168.0.31 is the PD address.
Did you deploy it using method one or method two? It looks like the dashboard wasn’t downloaded.
Method 1: Directly download the offline package
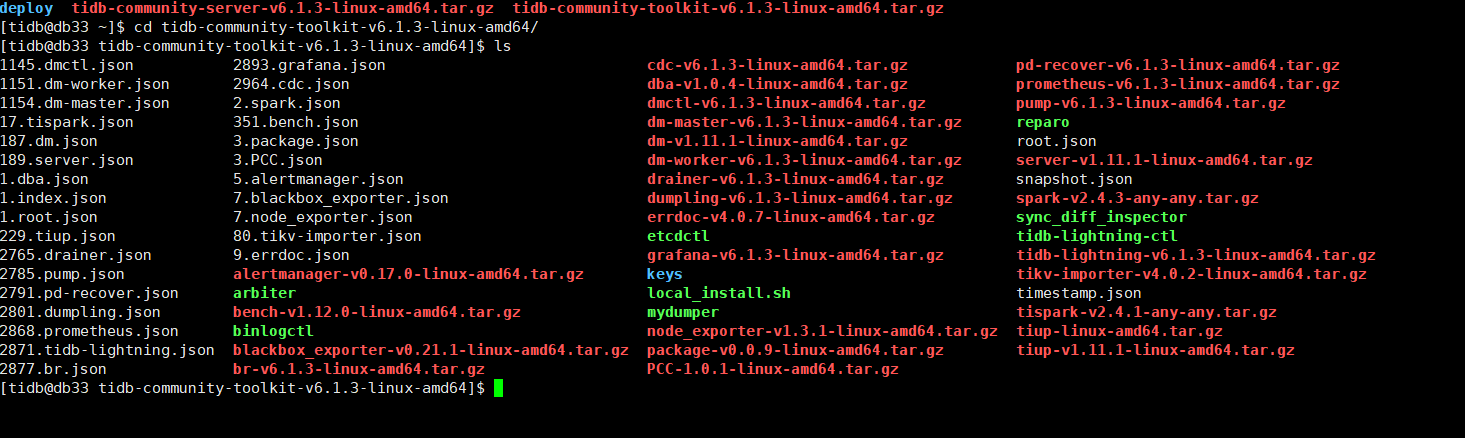
Isn’t the image merge done? You need to merge the two downloaded packages together.
I performed this operation. How can I check if the merge was successful?
Set the mirror directory to the server directory using tiup mirror set tidb-community-server-v6.1.3-linux-amd64. I encountered this yesterday as well.
Yes, give it a try. Yesterday, I couldn’t even execute the tiup cluster command.
Execute: tiup mirror show
See what the result is.
The results of the following commands are:
- tiup --version
- tiup list
[tidb@db33 ~]$ tiup list
Available components:
Name               Owner    Description
----               -----    -----------
PCC                pingcap  A tool used to capture plan changes among different versions of TiDB
alertmanager       pingcap  Prometheus alertmanager
bench              pingcap  Benchmark database with different workloads
blackbox_exporter  pingcap  Blackbox prober exporter
br                 pingcap  TiDB/TiKV cluster backup restore tool
cdc                pingcap  CDC is a change data capture tool for TiDB
cluster            pingcap  Deploy a TiDB cluster for production
ctl                pingcap  TiDB controller suite
dba                pingcap  dbatoolset
diag               pingcap  Clinic client for data collection and quick health check
dm                 pingcap  Data Migration Platform manager
dm-master          pingcap  dm-master component of Data Migration Platform
dm-worker          pingcap  dm-worker component of Data Migration Platform
dmctl              pingcap  dmctl component of Data Migration Platform
drainer            pingcap  The drainer component of TiDB binlog service
dumpling           pingcap  Dumpling is a CLI tool that helps you dump MySQL/TiDB data
errdoc             pingcap  Document about TiDB errors
grafana            pingcap  Grafana is the open source analytics & monitoring solution for every database
influxdb           pingcap  InfluxDB
insight            pingcap  TiDB-Insight collector
node_exporter      pingcap  Exporter for machine metrics
package            pingcap  A toolbox to package tiup component
pd                 pingcap  PD is the abbreviation for Placement Driver. It is used to manage and schedule the TiKV cluster
pd-recover         pingcap  PD Recover is a disaster recovery tool of PD, used to recover the PD cluster which cannot start or provide services normally
playground         pingcap  Bootstrap a local TiDB cluster for fun
prometheus         pingcap  The Prometheus monitoring system and time series database
pump               pingcap  The pump component of TiDB binlog service
server             pingcap  TiUP publish/cache server
spark              pingcap  Spark is a fast and general cluster computing system for Big Data
tidb               pingcap  TiDB is an open source distributed HTAP database compatible with the MySQL protocol
tidb-lightning     pingcap  TiDB Lightning is a tool used for fast full import of large amounts of data into a TiDB cluster
tiflash            pingcap  The TiFlash Columnar Storage Engine
tikv               pingcap  Distributed transactional key-value database, originally created to complement TiDB
tikv-importer      pingcap
tispark            pingcap  tispark
tiup               pingcap  TiUP is a command-line component management tool that can help to download and install TiDB platform components to the local system
- It feels like the relevant components are missing from the official binary package;
Was the tidb_dashboard_servers part generated using the tiup cluster template > topology.yaml command?
Can you upload it for a look? According to the comments, this part is for you to write the PD address.
I forgot from which version it started supporting the separation of dashboard and PD nodes deployment. Specifically, I haven’t done a separated deployment yet, so I don’t know if it supports splitting already deployed nodes.
tiup cluster template > topology.yaml I used this command to generate it
I didn’t see the dashboard in the package
# # Global variables are applied to all deployments and used as the default value of
# # the deployments if a specific deployment value is missing.
global:
  # # The user who runs the tidb cluster.
  user: "tidb"
  # # group is used to specify the group name the user belong to,if it's not the same as user.
  # group: "tidb"
  # # SSH port of servers in the managed cluster.
  ssh_port: 22
  # # Storage directory for cluster deployment files, startup scripts, and configuration files.
  deploy_dir: "/tidb/app/deploy"
  # # TiDB Cluster data storage directory
  data_dir: "/tidb/app/data"
  # # Supported values: "amd64", "arm64" (default: "amd64")
  arch: "amd64"
  # # Resource Control is used to limit the resource of an instance.
  # # See: https://www.freedesktop.org/software/systemd/man/systemd.resource-control.html
  # # Supports using instance-level `resource_control` to override global `resource_control`.
  # resource_control:
  #   # See: https://www.freedesktop.org/software/systemd/man/systemd.resource-control.html#MemoryLimit=bytes
  #   memory_limit: "2G"
  #   # See: https://www.freedesktop.org/software/systemd/man/systemd.resource-control.html#CPUQuota=
  #   # The percentage specifies how much CPU time the unit shall get at maximum, relative to the total CPU time available on one CPU. Use values > 100% for allotting CPU time on more than one CPU.
  #   # Example: CPUQuota=200% ensures that the executed processes will never get more than two CPU time.
  #   cpu_quota: "200%"
  #   # See: https://www.freedesktop.org/software/systemd/man/systemd.resource-control.html#IOReadBandwidthMax=device%20bytes
  #   io_read_bandwidth_max: "/dev/disk/by-path/pci-0000:00:1f.2-scsi-0:0:0:0 100M"
  #   io_write_bandwidth_max: "/dev/disk/by-path/pci-0000:00:1f.2-scsi-0:0:0:0 100M"


# # Monitored variables are applied to all the machines.
monitored:
  # # The communication port for reporting system information of each node in the TiDB cluster.
  node_exporter_port: 9100
  # # Blackbox_exporter communication port, used for TiDB cluster port monitoring.
  blackbox_exporter_port: 9115
  # # Storage directory for deployment files, startup scripts, and configuration files of monitoring components.
  # deploy_dir: "/tidb-deploy/monitored-9100"
  # # Data storage directory of monitoring components.
  # data_dir: "/tidb-data/monitored-9100"
  # # Log storage directory of the monitoring component.
  # log_dir: "/tidb-deploy/monitored-9100/log"

# # Server configs are used to specify the runtime configuration of TiDB components.
# # All configuration items can be found in TiDB docs:
# # - TiDB: https://pingcap.com/docs/stable/reference/configuration/tidb-server/configuration-file/
# # - TiKV: https://pingcap.com/docs/stable/reference/configuration/tikv-server/configuration-file/
# # - PD: https://pingcap.com/docs/stable/reference/configuration/pd-server/configuration-file/
# # - TiFlash: https://docs.pingcap.com/tidb/stable/tiflash-configuration
# #
# # All configuration items use points to represent the hierarchy, e.g:
# #   readpool.storage.use-unified-pool
# #           ^       ^
# # - example: https://github.com/pingcap/tiup/blob/master/embed/examples/cluster/topology.example.yaml
# # You can overwrite this configuration via the instance-level `config` field.
# server_configs:
  # tidb:
  # tikv:
  # pd:
  # tiflash:
  # tiflash-learner:
  # kvcdc:


# # Server configs are used to specify the configuration of PD Servers.
pd_servers:
  # # The ip address of the PD Server.
  - host: 192.168.0.31
    # # SSH port of the server.
    # ssh_port: 22
    # # PD Server name
    # name: "pd-1"
    # # communication port for TiDB Servers to connect.
    # client_port: 2379
    # # communication port among PD Server nodes.
    # peer_port: 2380
    # # PD Server deployment file, startup script, configuration file storage directory.
    deploy_dir: "/tidb/app/deploy/pd-2379"
    # # PD Server data storage directory.
    data_dir: "/tidb/app/data/pd-2379"
    # # PD Server log file storage directory.
    log_dir: "/tidb/app/deploy/pd-2379/log"
    # # numa node bindings.
    # numa_node: "0,1"
    # # The following configs are used to overwrite the `server_configs.pd` values.
    # config:
    #   schedule.max-merge-region-size: 20
    #   schedule.max-merge-region-keys: 200000
  - host: 192.168.0.35
    # ssh_port: 22
    # name: "pd-1"
    # client_port: 2379
    # peer_port: 2380
    deploy_dir: "/tidb/app/deploy/pd-2379"
    data_dir: "/tidb/app/data/pd-2379"
    log_dir: "/tidb/app/deploy/pd-2379/log"
    # numa_node: "0,1"
    # config:
    #   schedule.max-merge-region-size: 20
    #   schedule.max-merge-region-keys: 200000
  - host: 192.168.0.37
    # ssh_port: 22
    # name: "pd-1"
    # client_port: 2379
    # peer_port: 2380
    deploy_dir: "/tidb/app/deploy/pd-2379"
    data_dir: "/tidb/app/data/pd-2379"
    log_dir: "/tidb/app/deploy/pd-2379/log"
    # numa_node: "0,1"
    # config:
    #   schedule.max-merge-region-size: 20
    #   schedule.max-merge-region-keys: 200000

# # Server configs are used to specify the configuration of TiDB Servers.
tidb_servers:
  # # The ip address of the TiDB Server.
  - host: 192.168.0.31
    # # SSH port of the server.
    # ssh_port: 22
    # # Access the TiDB cluster port.
    port: 4000
    # # TiDB Server status information reporting port.
    status_port: 10080
    # # TiDB Server deployment file, startup script, configuration file storage directory.
    deploy_dir: "/tidb/app/deploy/tidb-4000"
    # # TiDB Server log file storage directory.
    log_dir: "/tidb/app/deploy/tidb-4000/log"
    # numa_node: "0" # suggest numa node bindings.
  - host: 192.168.0.35
    # ssh_port: 22
    port: 4000
    status_port: 10080
    deploy_dir: "/tidb/app/deploy/tidb-4001"
    log_dir: "/tidb/app/deploy/tidb-4001/log"
    # numa_node: "1" # suggest numa node bindings.
  - host: 192.168.0.37
    # ssh_port: 22
    port: 4000
    status_port: 10080
    deploy_dir: "/tidb/app/deploy/tidb-4000"
    log_dir: "/tidb/app/deploy/tidb-4000/log"
    # numa_node: "0" # suggest numa node bindings.


# # Server configs are used to specify the configuration of TiKV Servers.
tikv_servers:
  # # The ip address of the TiKV Server.
  - host: 192.168.0.31
    # # SSH port of the server.
    # ssh_port: 22
    # # TiKV Server communication port.
    port: 20160
    # # Communication port for reporting TiKV Server status.
    status_port: 20180
    # # TiKV Server deployment file, startup script, configuration file storage directory.
    deploy_dir: "/tidb/app/deploy/tikv-20160"
    # # TiKV Server data storage directory.
    data_dir: "/tidb/app/data/tikv-20160"
    # # TiKV Server log file storage directory.
    log_dir: "/tidb/app/deploy/tikv-20160/log"
    # numa_node: "0"
    # # The following configs are used to overwrite the `server_configs.tikv` values.
    # config:
    #   log.level: warn
  - host: 192.168.0.35
    # ssh_port: 22
    port: 20160
    status_port: 20180
    deploy_dir: "/tidb/app/deploy/tikv-20161"
    data_dir: "/tidb/app/data/tikv-20161"
    log_dir: "/tidb/app/deploy/tikv-20161/log"
    # numa_node: "1"
    # config:
    #   log.level: warn
  - host: 192.168.0.37
    # ssh_port: 22
    port: 20160
    status_port: 20180
    deploy_dir: "/tidb/app/deploy/tikv-20161"
    data_dir: "/tidb/app/data/tikv-20161"
    log_dir: "/tidb/app/deploy/tikv-20161/log"
    # numa_node: "0"
    # config:
    #   log.level: warn


# # Server configs are used to specify the configuration of TiFlash Servers.
tiflash_servers:
  # # The ip address of the TiFlash Server.
  - host: 192.168.0.31
    # # SSH port of the server.
    # ssh_port: 22
    # # TiFlash TCP Service port.
    tcp_port: 9000
    # # TiFlash HTTP Service port.
    http_port: 8123
    # # TiFlash raft service and coprocessor service listening address.
    flash_service_port: 3930
    # # TiFlash Proxy service port.
    flash_proxy_port: 20170
    # # Prometheus pulls TiFlash Proxy metrics port.
    flash_proxy_status_port: 20292
    # # Prometheus pulls the TiFlash metrics port.
    metrics_port: 8234
    # # TiFlash Server deployment file, startup script, configuration file storage directory.
    deploy_dir: /tidb/app/deploy/tiflash-9000
    ## With cluster version >= v4.0.9 and you want to deploy a multi-disk TiFlash node, it is recommended to
    ## check config.storage.* for details. The data_dir will be ignored if you defined those configurations.
    ## Setting data_dir to a ','-joined string is still supported but deprecated.
    ## Check https://docs.pingcap.com/tidb/stable/tiflash-configuration#multi-disk-deployment for more details.
    # # TiFlash Server data storage directory.
    data_dir: /tiflash/data/tiflash-9000
    # # TiFlash Server log file storage directory.
    log_dir: /tidb/app/deploy/tiflash-9000/log
  - host: 192.168.0.35
    # ssh_port: 22
    tcp_port: 9000
    http_port: 8123
    flash_service_port: 3930
    flash_proxy_port: 20170
    flash_proxy_status_port: 20292
    metrics_port: 8234
    deploy_dir: /tidb/app/deploy/tiflash-9001
    data_dir: /tiflash/data/tiflash-9001
    log_dir: /tidb/app/deploy/tiflash-9001/log
  - host: 192.168.0.37
    # ssh_port: 22
    tcp_port: 9000
    http_port: 8123
    flash_service_port: 3930
    flash_proxy_port: 20170
    flash_proxy_status_port: 20292
    metrics_port: 8234
    deploy_dir: /tidb/app/deploy/tiflash-9001
    data_dir: /tiflash/data/tiflash-9001
    log_dir: /tidb/app/deploy/tiflash-9001/log


# # Server configs are used to specify the configuration of TiKV-CDC Servers.
#kvcdc_servers:
#  - host: 192.168.0.31
#    # # SSH port of the server.
#    # ssh_port: 22
#    # # TiKV-CDC Server communication port.
#    port: 8600
#    # # TiKV-CDC Server data storage directory.
#    data_dir: "/tidb/app/data/tikv-cdc-8600"
#    # # TiKV-CDC Server log file storage directory.
#    log_dir: "/data1/tidb-deploy/tikv-cdc-8600/log"
#  - host: 192.168.0.35
#    port: 8600
#    data_dir: "/tidb/app/data/tikv-cdc-8600"
#    log_dir: "/tidb/app/deploy/tikv-cdc-8600/log"
#  - host: 192.168.0.37
#    port: 8600
#    data_dir: "/tidb/app/data/tikv-cdc-8600"
#    log_dir: "/tidb/app/deploy/tikv-cdc-8600/log"

# # Server configs are used to specify the configuration of TiDB Dashboard Servers.
tidb_dashboard_servers:
  # # The ip address of the PD Server.
  - host: 192.168.0.31
    # # SSH port of the server.
    # ssh_port: 22
    # # port of TiDB Dashboard
    # port: 2380
    # # TiDB Dashboard deployment file, startup script, configuration file storage directory.
    # deploy_dir: "/tidb-deploy/tidb-dashboard-23333"
    # # PD Server data storage directory.
    # data_dir: "/tidb-data/tidb-dashboard-23333"
    # # PD Server log file storage directory.
    # log_dir: "/tidb-deploy/tidb-dashboard-23333/log"
    # # numa node bindings.
    # numa_node: "0,1"


# # Server configs are used to specify the configuration of Prometheus Server.
monitoring_servers:
  # # The ip address of the Monitoring Server.
  - host: 192.168.0.33
    # # SSH port of the server.
    # ssh_port: 22
    # # Prometheus Service communication port.
    # port: 9090
    # # ng-monitoring servive communication port
    # ng_port: 12020
    # # Prometheus deployment file, startup script, configuration file storage directory.
    # deploy_dir: "/tidb-deploy/prometheus-8249"
    # # Prometheus data storage directory.
    # data_dir: "/tidb-data/prometheus-8249"
    # # Prometheus log file storage directory.
    # log_dir: "/tidb-deploy/prometheus-8249/log"
    # prometheus rule dir on TiUP machine
    # rule_dir: /home/tidb/prometheus_rule
    # scrape_interval: 15s
    # scrape_timeout: 10s
# # Server configs are used to specify the configuration of Grafana Servers.
grafana_servers:
  # # The ip address of the Grafana Server.
  - host: 192.168.0.33
    # # Grafana Web monitoring service client (browser) access port
    # port: 3000
    # # Grafana deployment file, startup script, configuration file storage directory.
    # deploy_dir: /tidb-deploy/grafana-3000
    # grafana dashboard dir on TiUP machine
    # dashboard_dir: /home/tidb/dashboards
    # config:
    #   log.file.level: warning

# # Server configs are used to specify the configuration of Alertmanager Servers.
alertmanager_servers:
  # # The ip address of the Alertmanager Server.
  - host: 192.168.0.33
    # # SSH port of the server.
    # ssh_port: 22
    # Alertmanager web service listen host.
    # listen_host: 0.0.0.0
    # # Alertmanager web service port.
    # web_port: 9093
    # # Alertmanager communication port.
    # cluster_port: 9094
    # # Alertmanager deployment file, startup script, configuration file storage directory.
    # deploy_dir: "/tidb-deploy/alertmanager-9093"
    # # Alertmanager data storage directory.
    # data_dir: "/tidb-data/alertmanager-9093"
    # # Alertmanager log file storage directory.
    # log_dir: "/tidb-deploy/alertmanager-9093/log"
    # # Alertmanager config file storage directory.
    # config_file: "/tidb-deploy/alertmanager-9093/bin/alertmanager/alertmanager.yml"
For version 6.1.1 and above, for offline upgrades, the offline source needs to merge both the server and toolkit packages.
This part should configure the PD address.
Check if there are any more errors.
Tried it, still got an error.