ON DUPLICATE KEY UPDATE Insert Slow

Note:
This topic has been translated from a Chinese forum by GPT and might contain errors.

Original topic: ON DUPLICATE KEY UPDATE 插入慢

| username: TiDBer_vC2lhR9G

To improve efficiency, please provide the following information. A clear problem description can help resolve the issue faster:

[TiDB Usage Environment] Production
[TiDB Version] 5.4
[Encountered Problem]

Our business has a scenario of batch insert and update, so we use the ON DUPLICATE KEY UPDATE feature. If the unique index does not exist, it inserts; if it exists, it updates.
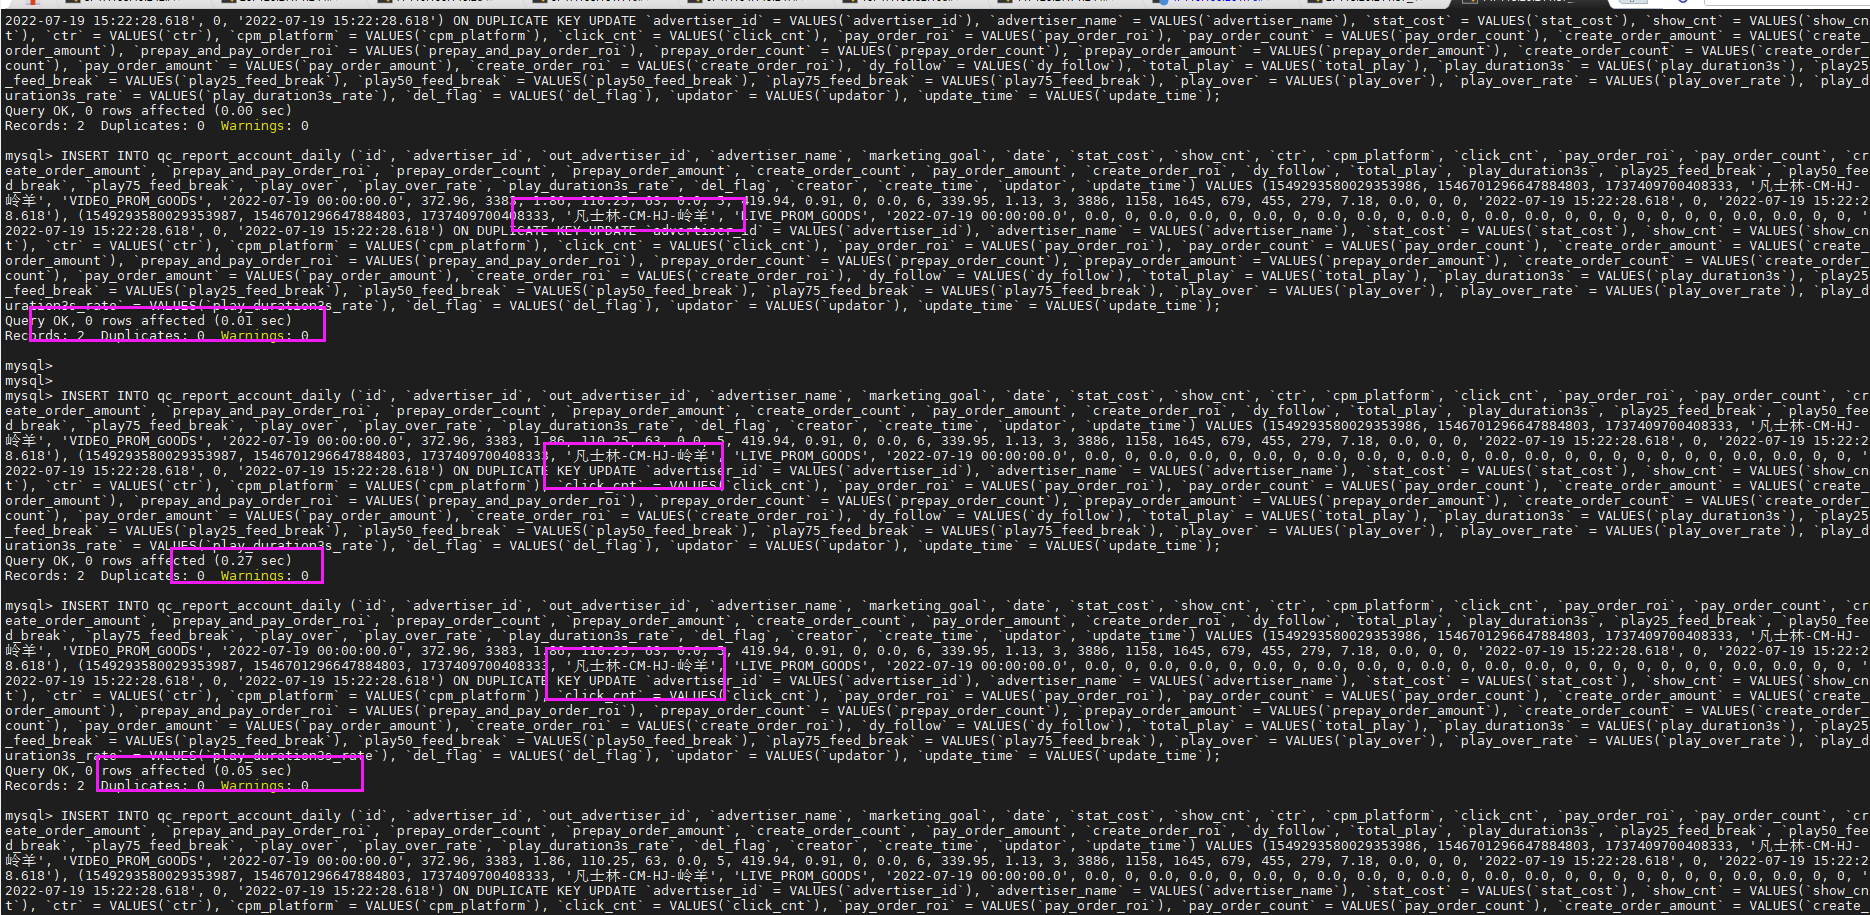
The SQL is as follows:

INSERT INTO qc_report_account_daily (`id`, `advertiser_id`, `out_advertiser_id`, `advertiser_name`, `marketing_goal`, `date`, `stat_cost`, `show_cnt`, `ctr`, `cpm_platform`, `click_cnt`, `pay_order_roi`, `pay_order_count`, `create_order_amount`, `prepay_and_pay_order_roi`, `prepay_order_count`, `prepay_order_amount`, `create_order_count`, `pay_order_amount`, `create_order_roi`, `dy_follow`, `total_play`, `play_duration3s`, `play25_feed_break`, `play50_feed_break`, `play75_feed_break`, `play_over`, `play_over_rate`, `play_duration3s_rate`, `del_flag`, `creator`, `create_time`, `updator`, `update_time`) VALUES (1548995354009075714, 1480189607163617287, 1719743539933197, 'Group 2 - City - Mingdi - Linfeng Small Shop - KN', 'VIDEO_PROM_GOODS', '2022-07-18 00:00:00.0', 0.0, 0, 0.0, 0.0, 0, 0.0, 0, 0.0, 0.0, 0, 0.0, 0, 0.0, 0.0, 0, 0, 0, 0, 0, 0, 0, 0.0, 0.0, 0, 0, '2022-07-18 19:37:25.995', 0, '2022-07-18 19:37:25.995'), (1548995354009075715, 1480189607163617287, 1719743539933197, 'Group 2 - City - Mingdi - Linfeng Small Shop - KN', 'LIVE_PROM_GOODS', '2022-07-18 00:00:00.0', 2.95, 124, 0.81, 23.79, 1, 0.0, 0, 0.0, 0.0, 0, 0.0, 0, 0.0, 0.0, 0, 108, 40, 28, 12, 6, 3, 2.78, 0.0, 0, 0, '2022-07-18 19:37:25.995', 0, '2022-07-18 19:37:25.995') ON DUPLICATE KEY UPDATE `advertiser_id` = VALUES(`advertiser_id`), `advertiser_name` = VALUES(`advertiser_name`), `stat_cost` = VALUES(`stat_cost`), `show_cnt` = VALUES(`show_cnt`), `ctr` = VALUES(`ctr`), `cpm_platform` = VALUES(`cpm_platform`), `click_cnt` = VALUES(`click_cnt`), `pay_order_roi` = VALUES(`pay_order_roi`), `pay_order_count` = VALUES(`pay_order_count`), `create_order_amount` = VALUES(`create_order_amount`), `prepay_and_pay_order_roi` = VALUES(`prepay_and_pay_order_roi`), `prepay_order_count` = VALUES(`prepay_order_count`), `prepay_order_amount` = VALUES(`prepay_order_amount`), `create_order_count` = VALUES(`create_order_count`), `pay_order_amount` = VALUES(`pay_order_amount`), `create_order_roi` = VALUES(`create_order_roi`), `dy_follow` = VALUES(`dy_follow`), `total_play` = VALUES(`total_play`), `play_duration3s` = VALUES(`play_duration3s`), `play25_feed_break` = VALUES(`play25_feed_break`), `play50_feed_break` = VALUES(`play50_feed_break`), `play75_feed_break` = VALUES(`play75_feed_break`), `play_over` = VALUES(`play_over`), `play_over_rate` = VALUES(`play_over_rate`), `play_duration3s_rate` = VALUES(`play_duration3s_rate`), `del_flag` = VALUES(`del_flag`), `updator` = VALUES(`updator`), `update_time` = VALUES(`update_time`);
out_advertiser_id + date form a unique index

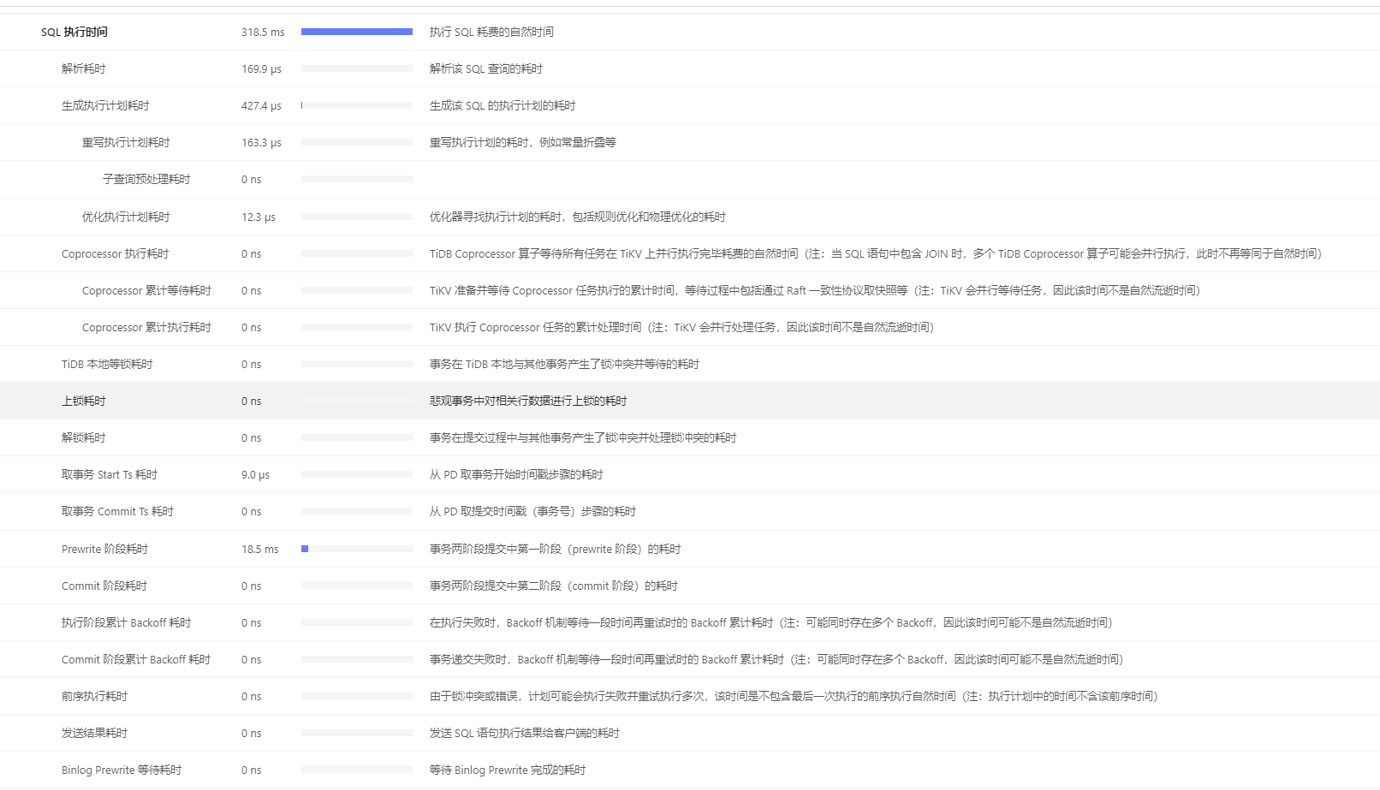
Executing this SQL takes about 350ms.


Experts, please take a look at what the problem might be. Thank you.

Machine configuration: 2 TiDB: 16C 32G, 3 TiKV: 16C 32G

| username: hey-hoho | Original post link

Please share the execution plan.

| username: cs58_dba | Original post link

I didn’t see the most time-consuming stage in the picture.

| username: Kongdom | Original post link

We are also using this syntax and it seems normal. However, we don’t have that many fields after the update, we only updated a few fields.
It’s still necessary to provide the execution plan and table health status for better judgment.

| username: wfxxh | Original post link

We also have such statements, but they are not slow.

| username: Mark | Original post link

Looking at the amount of inserts, for bulk operations, you also need to check if there are locks causing issues like gap locks. You can provide more related information for us to take a look.

| username: TiDBer_vC2lhR9G | Original post link

id       task   estRows operator info actRows execution info                                                                                                                                                                                                                                                                                                                                                                                                                                                                      memory  disk
Insert_1 root   0       N/A           0       time:1.01s, loops:1, prepare: 934.3ms, check_insert: {total_time: 73.1ms, mem_insert_time: 152.9µs, prefetch: 73ms, rpc:{BatchGet:{num_rpc:3, total_time:77.7ms}, total_wait_time: 77ms, scan_detail: {total_process_keys: 4, total_process_keys_size: 886, total_keys: 6, rocksdb: {delete_skipped_count: 0, key_skipped_count: 0, block: {cache_hit_count: 63, read_count: 1, read_byte: 4.80 KB}}}}}, commit_txn: {prewrite:2.67ms, region_num:2, write_keys:6, write_byte:887} 6.67 KB N/A
| username: TiDBer_vC2lhR9G | Original post link

The insert volume is not large, with only 2 values, and the table data is approximately around 2 million. The execution plan is posted below, please take a look.

| username: TiDBer_vC2lhR9G | Original post link

I’m also confused, I didn’t see it either, but the execution time of the first SQL did report more than 300 milliseconds.

| username: cs58_dba | Original post link

Indeed, we need to check the health of the table.

| username: TiDBer_vC2lhR9G | Original post link

This is another one, 1 second. I looked at the execution plan, prepare: 934.3ms, is this the problem?

| username: wfxxh | Original post link

What is the current load status of your cluster?

| username: ealam_小羽 | Original post link

Check the CPU, memory, IO, and network status. It seems like it might be a machine issue.

| username: TiDBer_vC2lhR9G | Original post link

Table Health

| username: Kongdom | Original post link

The health is normal. Have you compared the execution of statements with duplicate primary keys and statements without duplicate primary keys?

| username: TiDBer_vC2lhR9G | Original post link

It seems the load is okay.

| username: wfxxh | Original post link

Brother, do you only have one PD node online? :sweat_smile:

| username: TiDBer_vC2lhR9G | Original post link

Yes, it doesn’t feel like there’s any pressure. The PD CPU and memory have been very stable.

| username: TiDBer_vC2lhR9G | Original post link

I executed SQL directly on the TiDB server and found a pattern. During concurrent business inserts, most of them are relatively fast, completing in about 0.02 seconds. However, occasionally, there are slow inserts.


Execution process:

	id      	task	estRows	operator info	actRows	execution info                                                                                                                                                                                                                                                                                                                                                                                                                                                                                                  	memory 	disk
	Insert_1	root	0      	N/A          	0      	time:329.9ms, loops:1, prepare: 313.4ms, check_insert: {total_time: 16.5ms, mem_insert_time: 175.2µs, prefetch: 16.3ms, rpc:{BatchGet:{num_rpc:3, total_time:18.3ms}, total_process_time: 1ms, total_wait_time: 17ms, scan_detail: {total_process_keys: 4, total_process_keys_size: 845, total_keys: 6, rocksdb: {delete_skipped_count: 0, key_skipped_count: 0, block: {cache_hit_count: 61, read_count: 1, read_byte: 15.9 KB}}}}}, commit_txn: {prewrite:4.49ms, region_num:2, write_keys:6, write_byte:846}	6.59 KB	N/A
| username: Kongdom | Original post link

If it is sporadic, it cannot be ruled out that it is caused by concurrency leading to an update, or an incorrect execution plan was chosen.