Note:
This topic has been translated from a Chinese forum by GPT and might contain errors.
Original topic: 其中一台tikv IO繁忙
【TiDB Usage Environment】Production environment
【TiDB Version】5.4.1
【Encountered Problem】One of the TiKV nodes has high IO usage. How should I troubleshoot this?
【Reproduction Path】
【Problem Phenomenon and Impact】
Is there any operation currently being performed? It feels like there is a hotspot.
Could you please provide the thread CPU details in tikv-details?
How is the distribution of Leader regions in the KV cluster?
Didn’t perform any operations.
The default value of tidb_gc_life_time is 10m, which means that the data deleted 10 minutes ago will be cleaned up by GC. If you want to delete a large amount of data, it is recommended to set tidb_gc_life_time to a larger value, such as 24h, before deleting. After the deletion is completed, set it back to the original value.
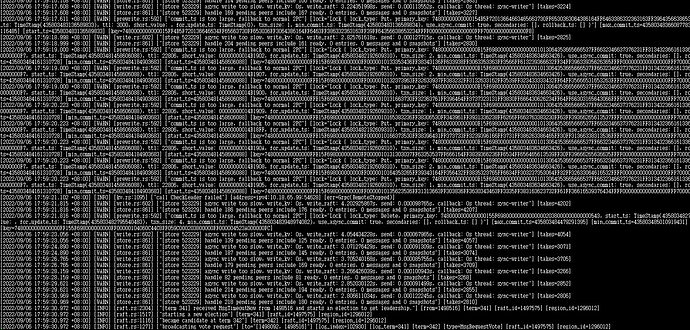
Please take a screenshot of the unified read pool CPU. Additionally, check the disk usage to see if it has reached or exceeded 70%. The logs seem to indicate that there are many large transactions being committed.
The image is not visible. Please provide the text you need translated.
The image is not visible, please provide the text you need translated.
If the number of regions is consistent and there are no hotspot issues, it could be a hardware problem…
Some investigation is needed.
It doesn’t seem like there’s a hotspot issue. Could it be that the disks on the three machines are inconsistent, or the disks are almost full, triggering a write stall or something similar?
First, rule out the possibility of hotspot issues.
The other three KV nodes are all 163G, but this problematic node is using 152G.
Check to see whether it is rocksdb raft or rocksdb kv that is consuming the IO.
Take a look at these few places to see if there are any high latency situations.
The leader distribution is okay. Which hotspot are you referring to?
https://metricstool.pingcap.com/#backup-with-dev-tools Export the TiDB\TiKV detail\overview\node_export (hosts with high I/O) monitoring by clicking here. Make sure to expand all and wait for all panels to unfold and load the data completely.
