Note:
This topic has been translated from a Chinese forum by GPT and might contain errors.
Original topic: Tikv服务器宕机一台,引发region大量增长
【TiDB Usage Environment】Online failure
【TiDB Version】5.0.6
【Encountered Problem】
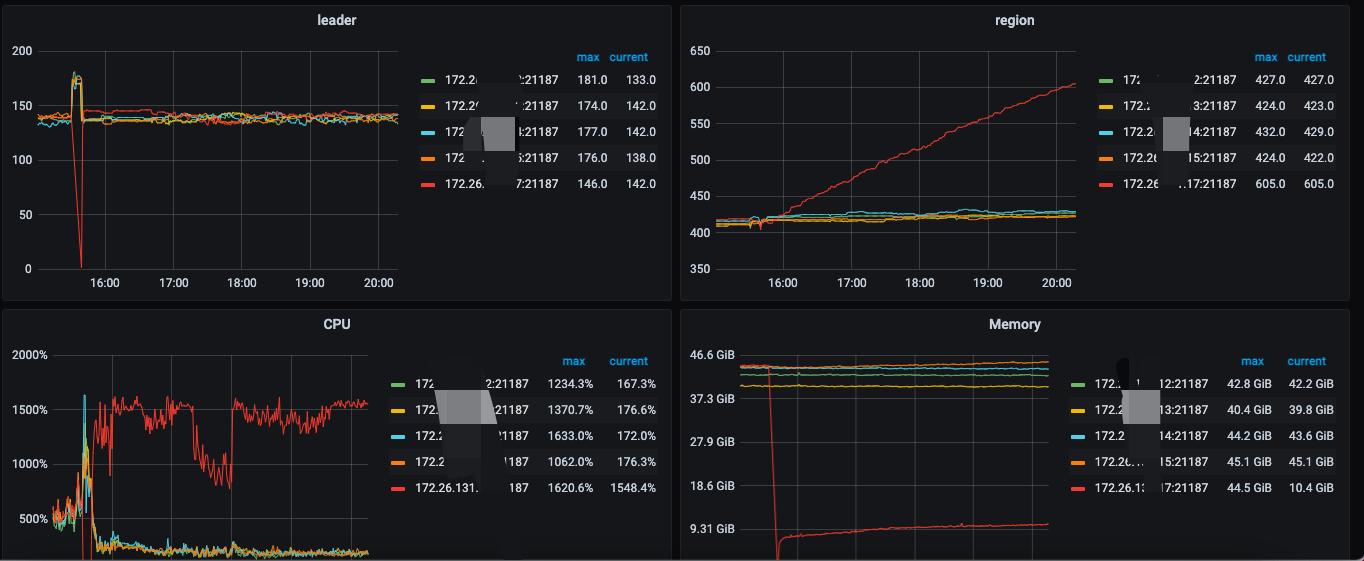
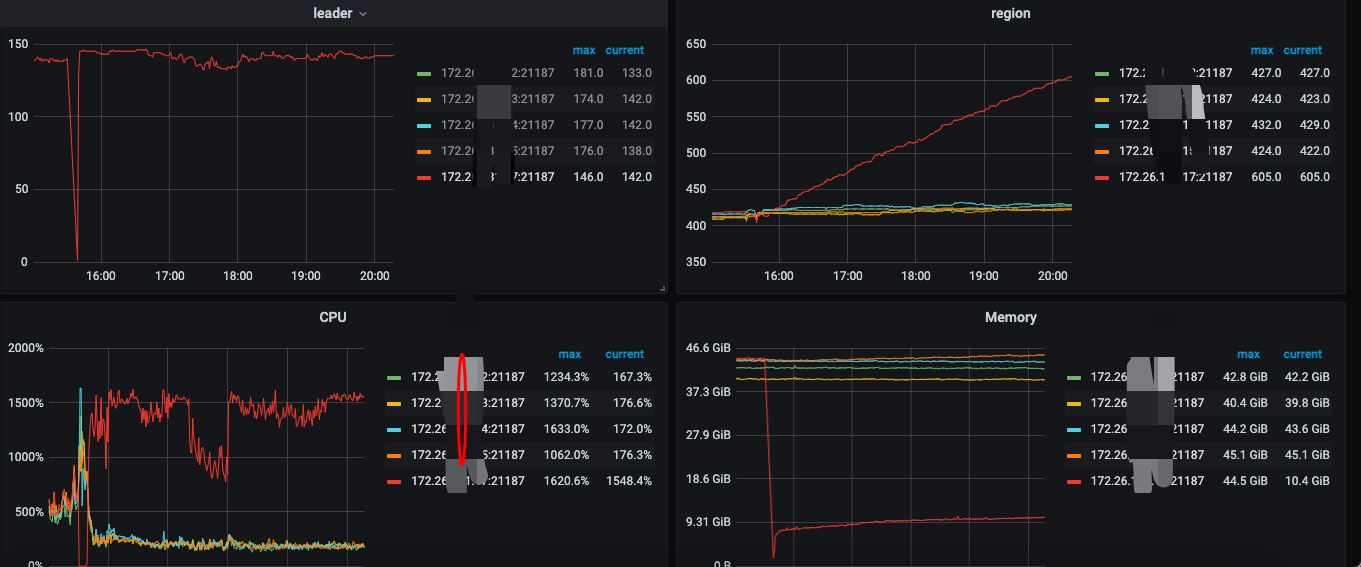
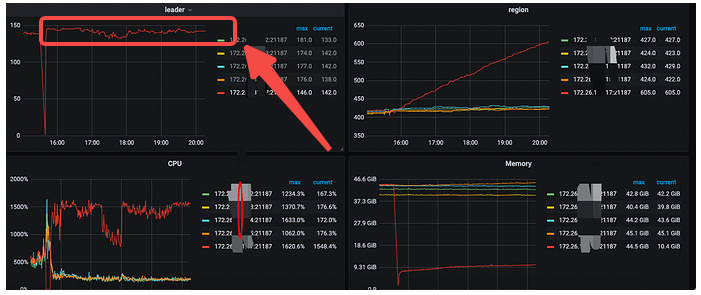
TiKV server crashed, then regions started to increase significantly, leading to higher CPU resource consumption.
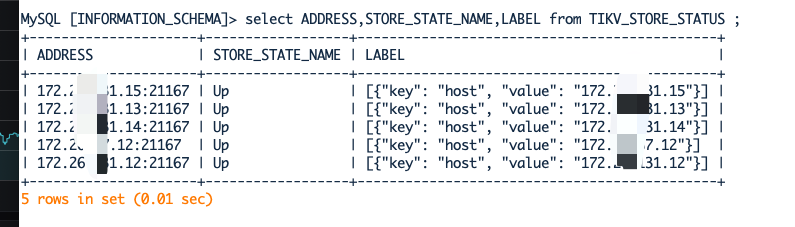
Out of 5 TiKV servers, one server crashed, and then regions started to grow rapidly, even though there was no significant write activity during this period.
Other nodes also experienced growth, but not as fast as the crashed machine.
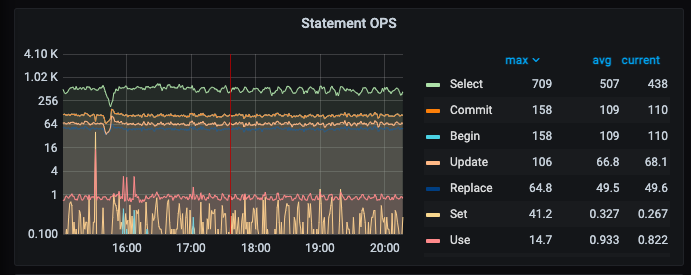
This was my QPS at the time.
【Reproduction Path】
What operations were performed to cause the issue
【Problem Phenomenon and Impact】
【Attachments】
Please provide the version information of each component, such as cdc/tikv, which can be obtained by executing cdc version/tikv-server --version.
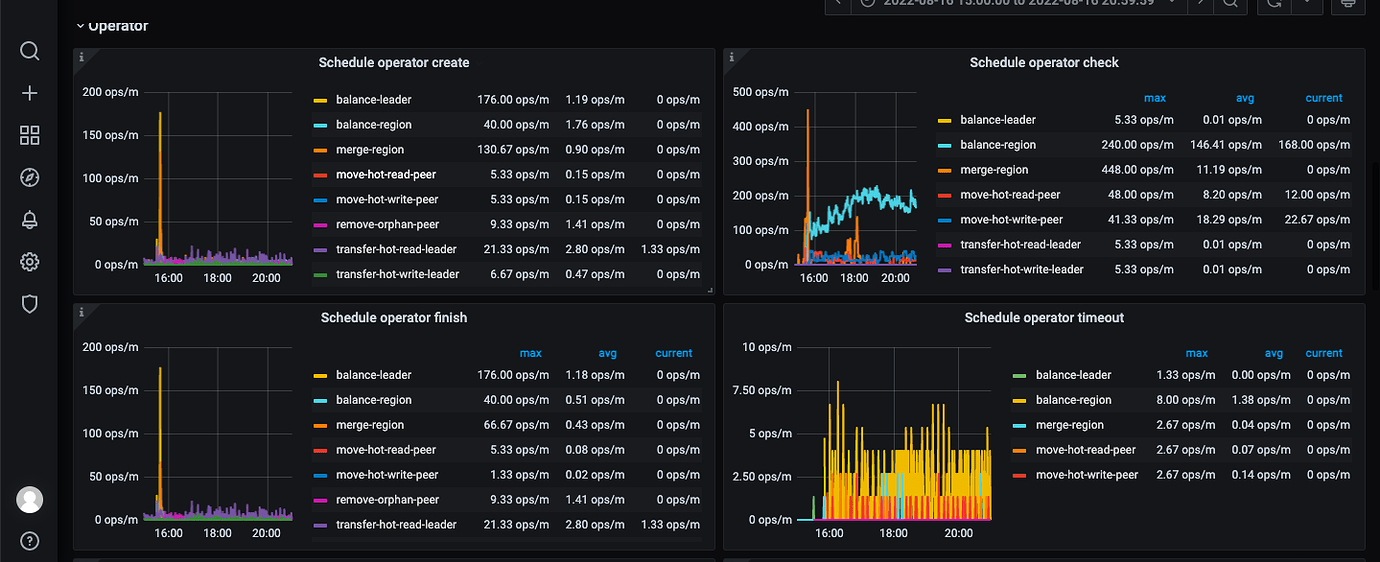
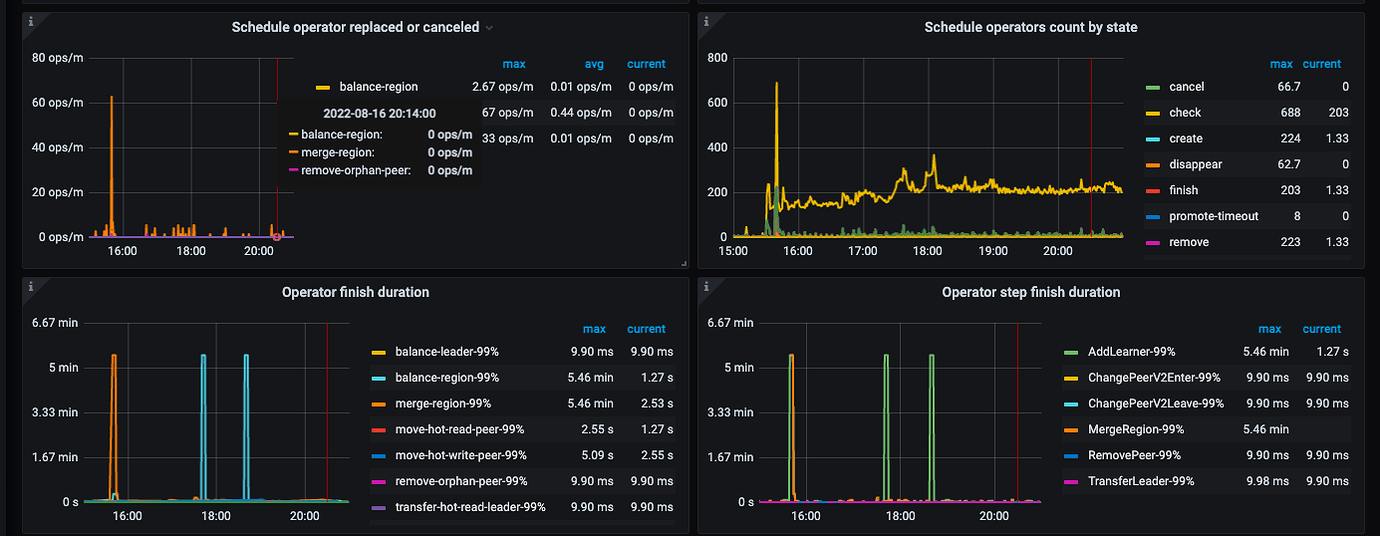
Take a look at the operator on the PD panel in Grafana to see what it’s doing.
How many regions are there on this? You can check the PD panel to see why so many region schedules are being generated.
If it’s caused by scheduling, try reducing the region-schedule-limit.
Are there any anomalies in the tidb.log? If there is an unexpected surge in regions;
It seems that tikv has been down for less than 30 minutes, not sure if it has anything to do with region replenishment.
It looks like tikv was down for less than 30 minutes, around 10 minutes.
Is it completely down? Or is it the kind that is half-dead (occasionally has a heartbeat)? If it’s the latter, I suggest shutting it down directly.
What value? Has it been changed?
First, try reducing the region-schedule-limit to see if it alleviates the issue.
The issue has been resolved, but I want to find the root cause.
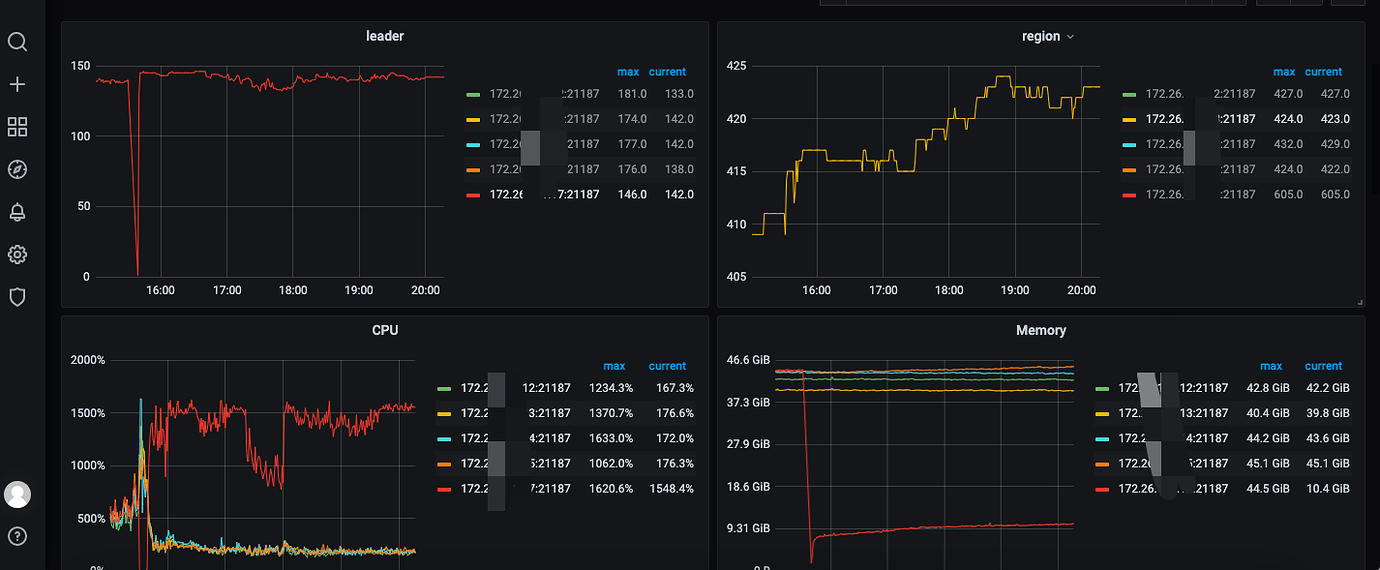
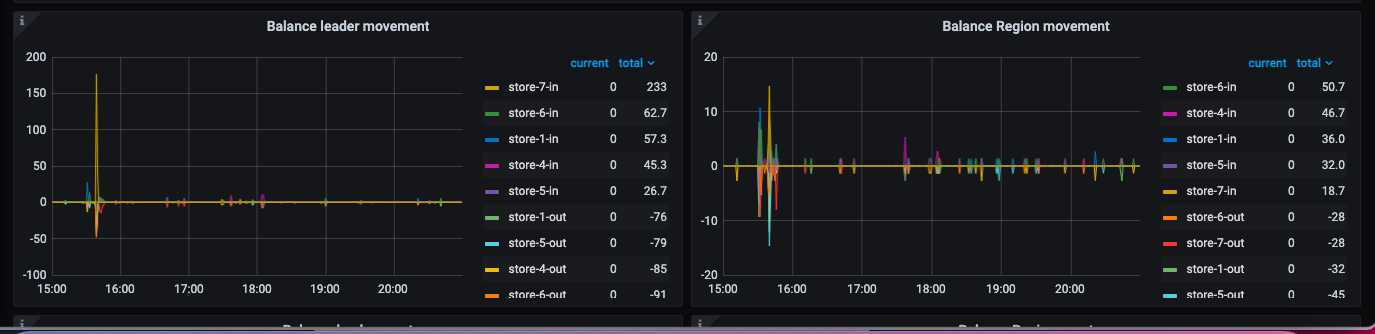
Isn’t this balancing regions? You only have a few hundred in total. When balancing regions, the old TiKV adds a replica, and the new TiKV deletes a replica. This way, the total number of replicas increases by one, so the number of regions increases.
Looking at the machine you said was down, it doesn’t seem to be down; it looks like it went down and then recovered. Why are you censoring a 172 IP address, bro? If the red lines are all the same TiKV, it’s unclear why replicas are being added to this one…
I want to know if it is a bug. If it is a bug, report it to the official team.
Could you please provide the tikv.log for this node?
The image is not visible. Please provide the text you need translated.
TiDB’s logs. After recovery, all requests are directed to the machine that went down.
It should be that the region cache hasn’t been cleared. If the business can tolerate it, it will self-heal after a while.
The logs for the hang are gone. TiKV, but there are logs for the time 2022/08/16 16:37:12.471 +08:00
A large number of
[2022/08/16 16:37:12.471 +08:00] [WARN] [region_request.go:694] [“tikv reports ServerIsBusy retry later”] [reason=“scheduler is busy”] [ctx=“region ID: 6242178, meta: id:6242178 start_key:"t\200\000\000\000\000\000\000R_i\200\000\000\000\000\000\000\014\001\000\000\000\000\000\000\000\000\367\003\200\000\000\000\006\034W\371" end_key:"t\200\000\000\000\000\000\000R_i\200\000\000\000\000\000\000\014\001JD190812\37714064854\3773228\000\000\000\000\373\003\200\000\000\000\004\036\317\247" region_epoch:<conf_ver:11621 version:2589 > peers:<id:6309747 store_id:1 > peers:<id:6313712 store_id:44598 > peers:<id:6316950 store_id:4 > , peer: id:6313712 store_id:44598 , addr: 172.26.131.17:21162, idx: 1, reqStoreType: TiKvOnly, runStoreType: tikv”]
The duration lasted from 16:00 to 22:00, with CPU and region continuously increasing until the business was blocked. It only recovered after manually restarting the cluster. If it was due to the cache not being cleared, it wouldn’t have taken this long.
The reason for the business blockage should be due to the leader + tikv server is busy, causing the blockage;
tikv reports `ServerIsBusy`
Yes, I am curious why his region has such a large increase.
I thought it was still reporting “cop to wrong store” even after the business was restored.