OOM Issue Caused by Goroutine Leak in TiDB v5.2.1

Note:
This topic has been translated from a Chinese forum by GPT and might contain errors.

Original topic: TiDB v5.2.1 goroutine泄漏出现的OOM问题

| username: fenghaojiang

[TiDB Usage Environment] Online
[TiDB Version] TiDB v5.2.1

[Encountered Problem]
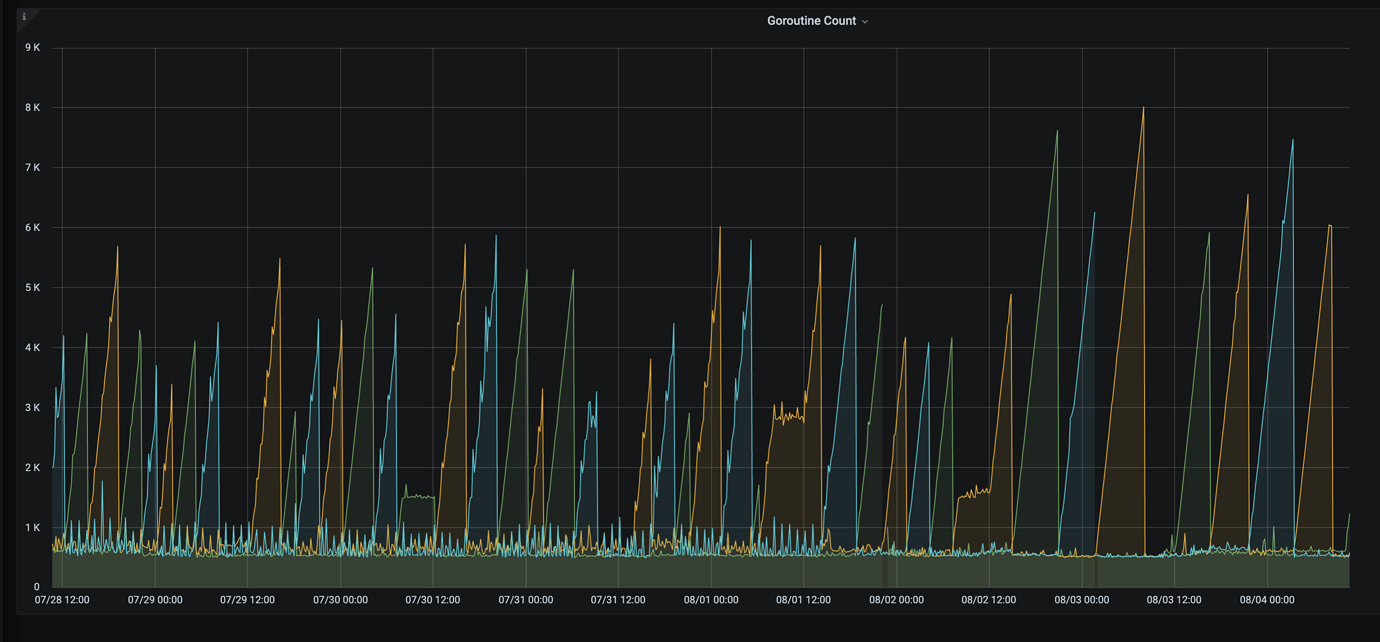
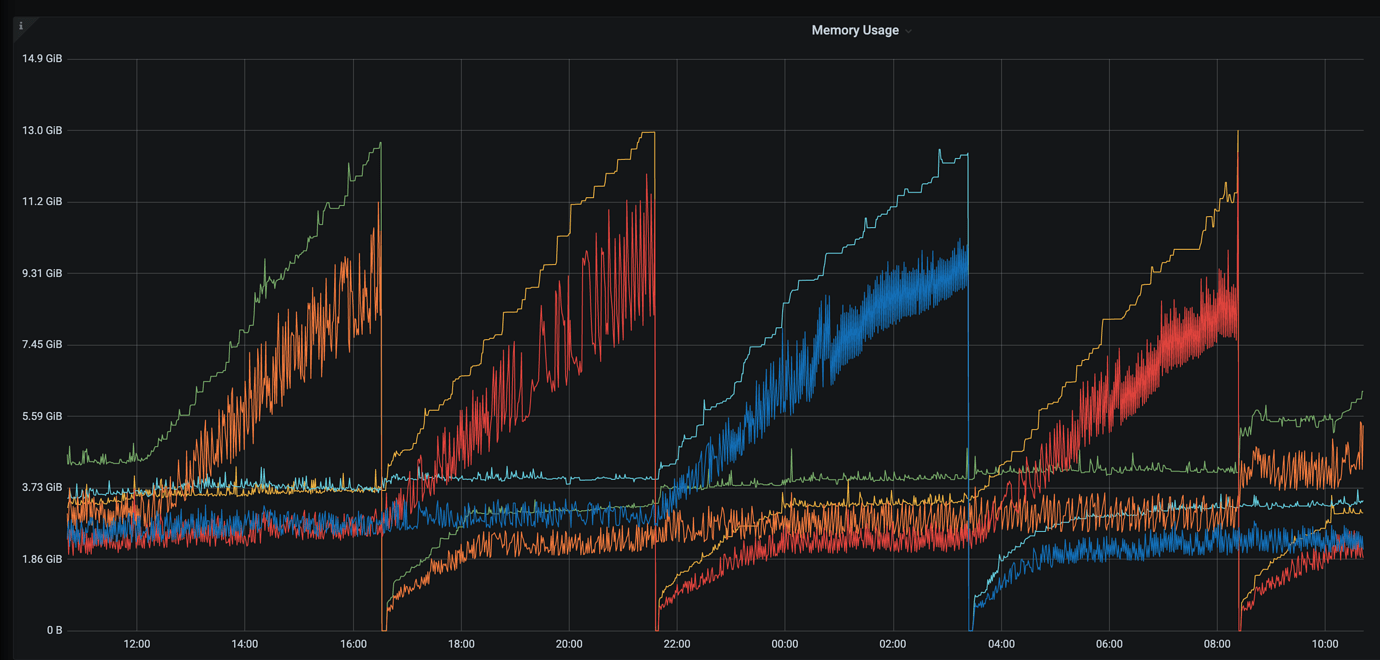
Goroutine leak, the number of goroutines will surge, and when it reaches a certain level, it will cause an OOM restart. This situation will repeatedly occur.

[Problem Phenomenon and Impact]
TiDB logs
goroutine 104283480 [chan receive, 124 minutes]: github.com/pingcap/tidb/executor.(*AnalyzeColumnsExec).subMergeWorker(0xc121284900, 0xc05e51eae0, 0xc05e51eb40, 0x17, 0x1) /home/jenkins/agent/workspace/optimization-build-tidb-linux-amd/go/src/github.com/pingcap/tidb/executor/analyze.go:1201 +0x4e5 created by github.com/pingcap/tidb/executor.(*AnalyzeColumnsExec).buildSamplingStats /home/jenkins/agent/workspace/optimization-build-tidb-linux-amd/go/src/github.com/pingcap/tidb/executor/analyze.go:849 +0x68b goroutine 96834476 [chan receive, 147 minutes]: github.com/pingcap/tidb/executor.(*AnalyzeColumnsExec).subMergeWorker(0xc0af5757a0, 0xc0ca34ab40, 0xc0ca34b1a0, 0x17, 0x1) /home/jenkins/agent/workspace/optimization-build-tidb-linux-amd/go/src/github.com/pingcap/tidb/executor/analyze.go:1201 +0x4e5 created by github.com/pingcap/tidb/executor.(*AnalyzeColumnsExec).buildSamplingStats /home/jenkins/agent/workspace/optimization-build-tidb-linux-amd/go/src/github.com/pingcap/tidb/executor/analyze.go:849 +0x68b

| username: xfworld | Original post link

Can you check at what time point, if there was any special operation that caused it?

| username: fenghaojiang | Original post link

Starting from July 26th, a new service was added that led to more data being written, but the QPS is not particularly high.

| username: xfworld | Original post link

Is it caused by large transactions? I suggest thoroughly checking the relevant metrics of each node.

TiDB OOM can be caused by:

  1. Batch insert
  2. Query SQL operators not supporting pushdown, requiring aggregation before processing
  3. Batch update

Are there any other TiDB service nodes experiencing similar issues?

| username: fenghaojiang | Original post link

There are batch insert/update operations with a QPS of around 2k-3k. Can we only reduce concurrent processing? I checked the logs, and the mem_max in the Top 10 SQL is around 60-70k. I’ll check the other nodes.

| username: fenghaojiang | Original post link

Supplement: The goroutine surge will alternate between different nodes until OOM.

| username: fenghaojiang | Original post link

It should be a large number of goroutines blocked at this position:

| username: xfworld | Original post link

There is no need to reduce concurrency. It doesn’t seem to be the issue. If the transaction is large, you can break it down into smaller ones, essentially splitting a long transaction into many small transactions, if the business logic allows it.

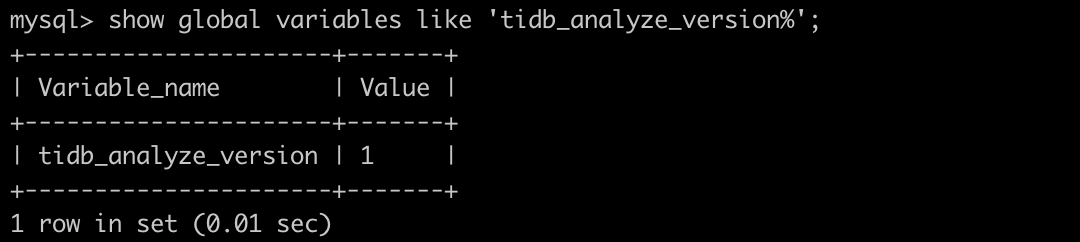
Also, does the cluster have a defined auto Analyze feature?

| username: fenghaojiang | Original post link

There is an Auto Analyze feature, but it keeps reporting errors. The error messages are similar to the following:
[2022/08/03 08:31:27.862 +00:00] [ERROR] [update.go:1085] [“[stats] auto analyze failed”] [sql=“analyze table %n.%nindex %n”] [cost_time=4.24714ms] [error=“other error: invalid data type: Failed to decode row v2 data as u64”]

| username: xfworld | Original post link

I suggest turning off the Auto Analyze feature first, as it can affect both read and write operations.

After turning it off, you can check the health of the tables. For tables with poor health, you can manually analyze them during non-peak business hours.

invalid data type: Failed to decode row v2 data as u64
This error seems to be a decoding issue… It’s a bit strange.

| username: fenghaojiang | Original post link

There might be an error in the index type definition; I’ll check it again.

| username: fenghaojiang | Original post link

It seems like this is the issue. I’ll go ahead and submit a feature request. The reproduction path is to change the data type of a column in an existing table, where that column previously had an index. The data type of that column in the table was changed, but the index was not updated. As a result, auto analyze keeps reporting data type conversion errors.

The feature request is to automatically update the data type of the index when modifying the column.

| username: xfworld | Original post link

Modifying the data type of an index column with DDL caused the original index values to not be cleared and backfilled, right?

It’s best to collect the operation scenario. If it can be reproduced, it’s definitely a bug. :+1:

| username: songxuecheng | Original post link

Please check the value of tidb_analyze_version.

| username: fenghaojiang | Original post link

| username: songxuecheng | Original post link

I tried to reproduce this issue on version 6.1 but couldn’t. Could you please specify what type you modified to what type?

| username: fenghaojiang | Original post link

I tried to reproduce it on a MacBook but was not successful. Manually executing analyze table also did not result in the type error that appeared in the production environment.

tiup playground v5.2.1 --db 2 --pd 3 --kv 3

At that time, it was changed from varchar(256) null to bigint unsigned null.

Is it possible that there was an issue during the change process (such as a lost connection), causing the schema of the index file to have two different versions?

| username: songxuecheng | Original post link

Still not reproduced. May I ask how much data there is?

| username: fenghaojiang | Original post link

Approximately around 25 million rows of data.

| username: fenghaojiang | Original post link

Changing the data type of a column is not done using transactions. Modifying the field type takes too long, and there might be issues midway, resulting in incomplete changes.