Note:
This topic has been translated from a Chinese forum by GPT and might contain errors.
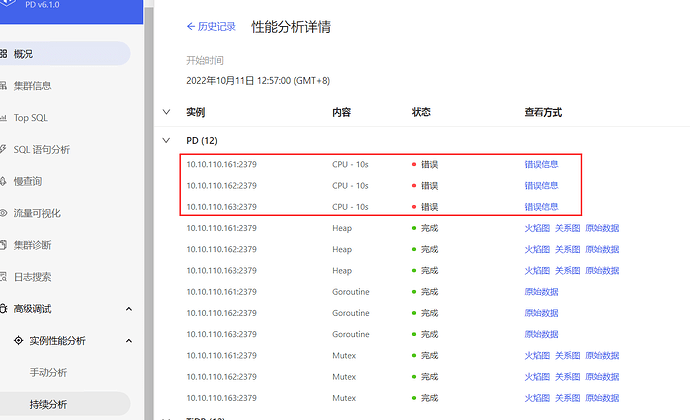
Original topic: pd 和 kv cpu-10s 状态为:错误
[TiDB Usage Environment] Production Environment
[TiDB Version] v6.1
[Encountered Issue]
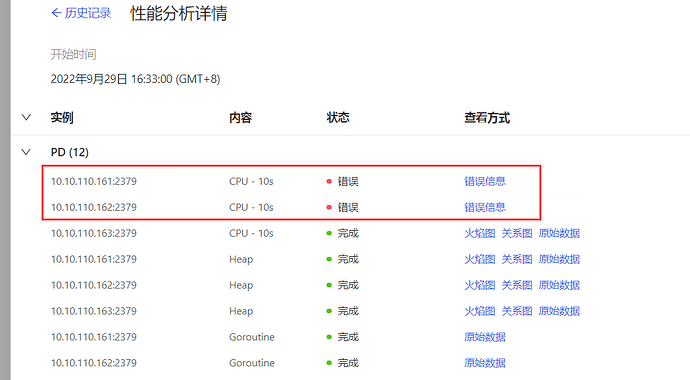
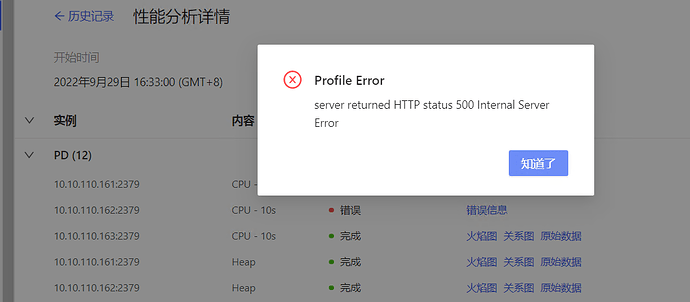
In continuous performance analysis, the status of pd and kv cpu-10 is shown as: error
[Reproduction Path]
[Issue Phenomenon and Impact]
Attached are the logs and performance analysis logs
[Attachments] logs (3).zip (110.2 KB) profile_2022-09-29_13-08-00.zip (345.9 KB)
The question is not clearly described, please provide more details.
I didn’t understand what it means.
How should this be handled?
When is it executed? Is it during the time period shown in the picture? If so, check what the IPs behind it are doing, as there might be abnormal network communication between them.
Communication between PDs is not working.
Here’s the status overview of the TiUP cluster~
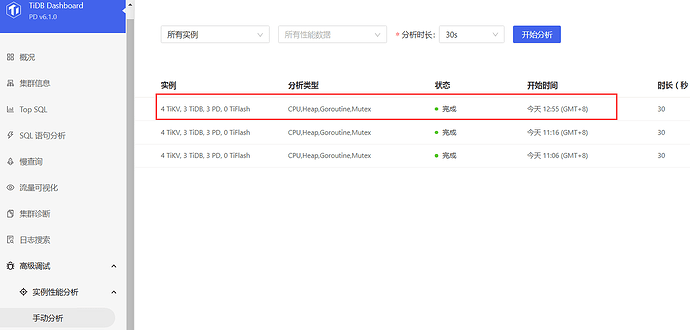
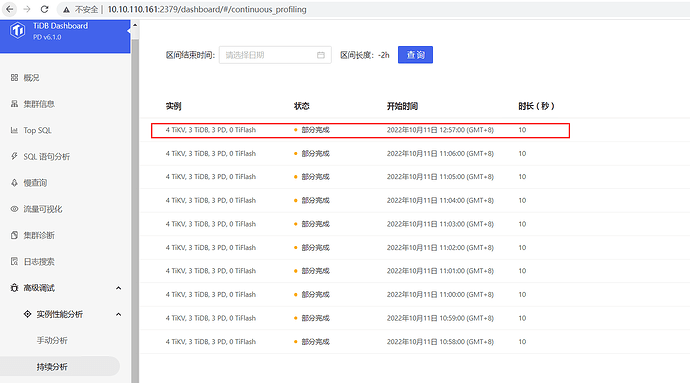
This issue occurs when real-time performance analysis is enabled. When real-time performance analysis is disabled, manual performance analysis works normally. As shown in the images below:
Manual Analysis:
Continuous Analysis:
Are the firewalls between the nodes turned off?
The firewall is turned off.
