PD dashboard is inaccessible and keeps loading

Note:
This topic has been translated from a Chinese forum by GPT and might contain errors.

Original topic: PD dashboard 无法访问,一直在加载

| username: guoyanliang

【TiDB Usage Environment】Production Environment
【TiDB Version】5.4.2 5.4.3
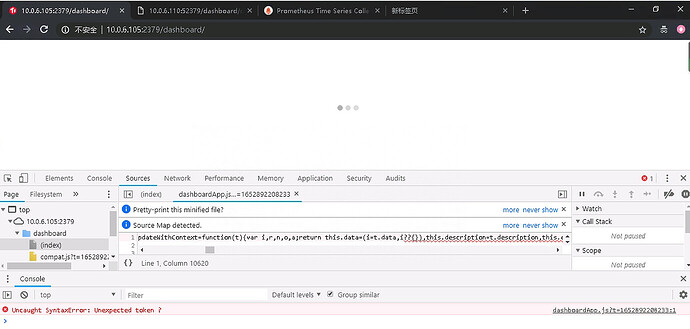
【Encountered Problem】Unable to access 2379/dashboard, it keeps loading, as shown in the picture

【Reproduction Path】Initially thought it was an issue with 5.4.2, but after upgrading to 5.4.3, the problem still persists.
【Problem Phenomenon and Impact】

【Attachments】

Please provide the version information of each component, such as cdc/tikv, which can be obtained by executing cdc version/tikv-server --version.
| username: xfworld | Original post link

Check the cluster status with tiup to see which PD the dashboard is on.

| username: Raymond | Original post link

If tiup cluster display shows that PD is fine, try using a higher version of the browser or clearing the browser cache.

| username: gary | Original post link

Check if the monitoring node status is normal. If not, check the log for errors.

| username: forever | Original post link

Try using Google or Edge. It works fine in my environment, but with IE, it just keeps loading.

| username: guoyanliang | Original post link

Indeed, I thought it was displaying normally in version 5.4.0, so I didn’t consider the browser issue. :joy:

| username: guoyanliang | Original post link

So cool, my cousin has already certified it. :+1:

| username: system | Original post link

This topic was automatically closed 60 days after the last reply. New replies are no longer allowed.