Note:
This topic has been translated from a Chinese forum by GPT and might contain errors.
Original topic: PD内存持续升高,大量goroutine产生最终导致整个集群不可用
[TiDB Usage Environment] Production Environment
[TiDB Version] 6.5.0
[Reproduction Path] Unknown
[Encountered Problem: Phenomenon and Impact]
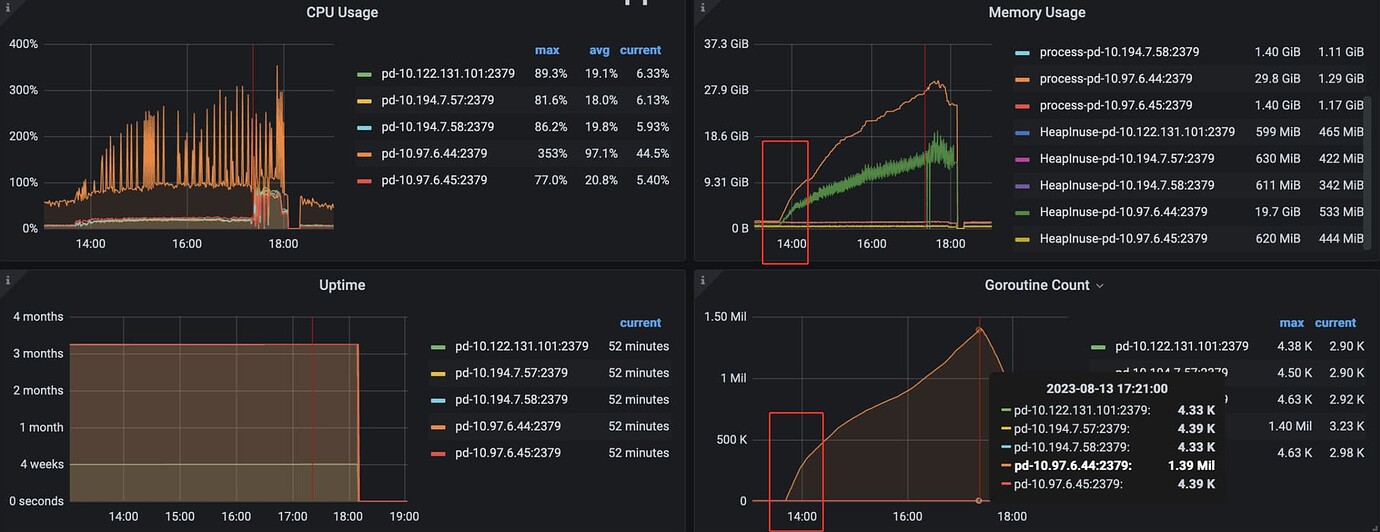
Memory increased significantly, eventually triggering swap, causing the entire TiDB cluster to become unavailable. Can we find out what caused the sudden increase in memory?
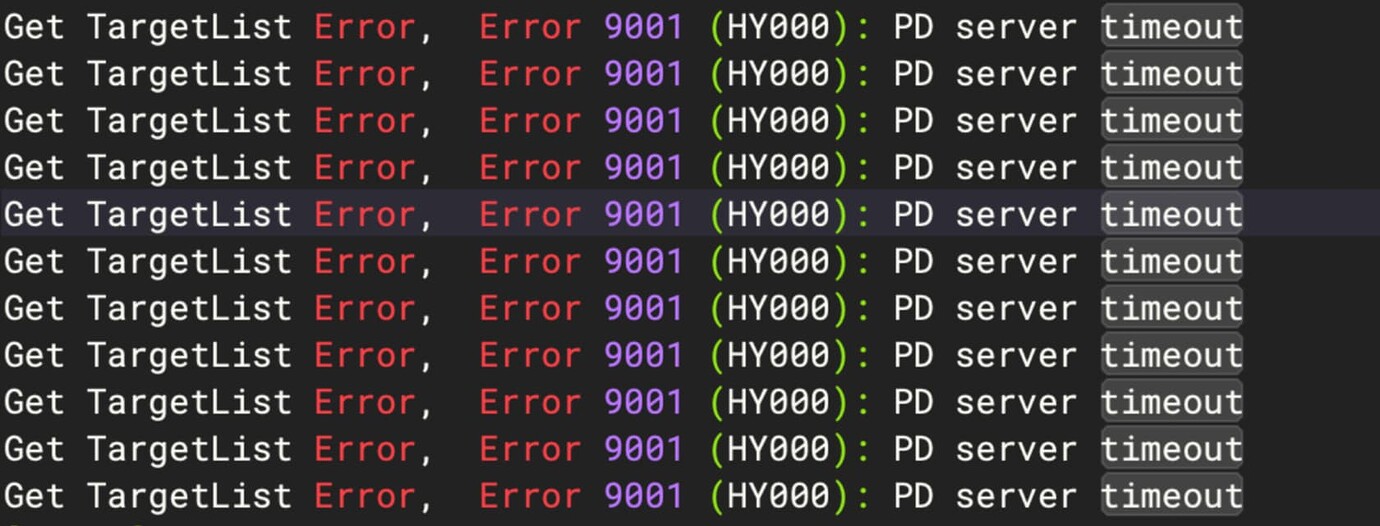
Client reports
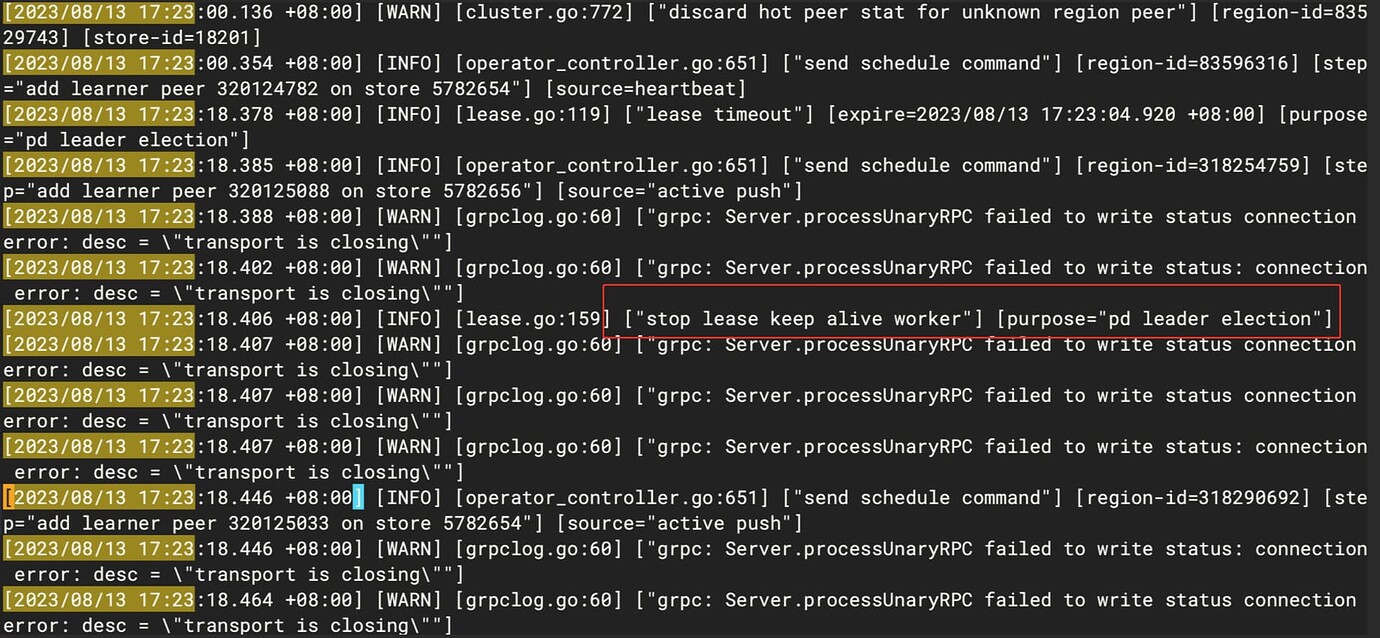
From the PD leader logs, there was a PD election, but from the final result, there was no leader switch
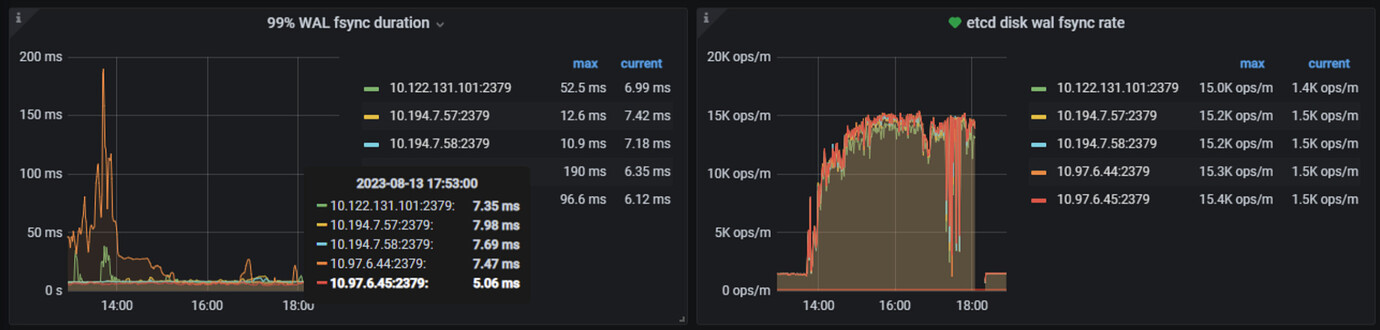
There are a lot of fsync operations in etcd
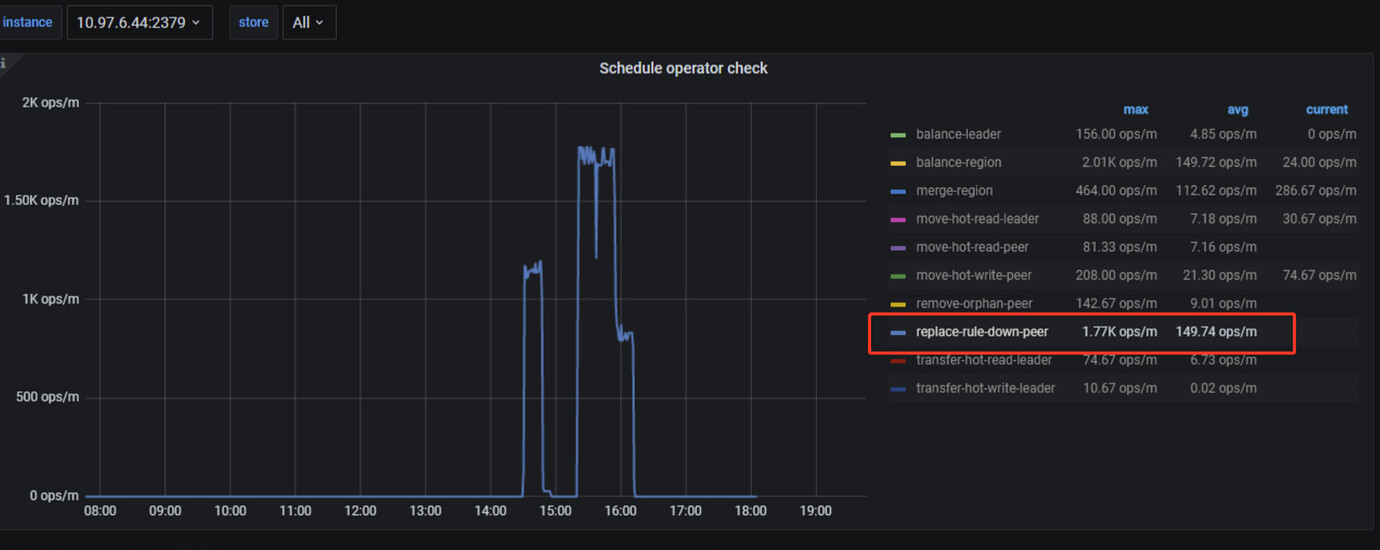
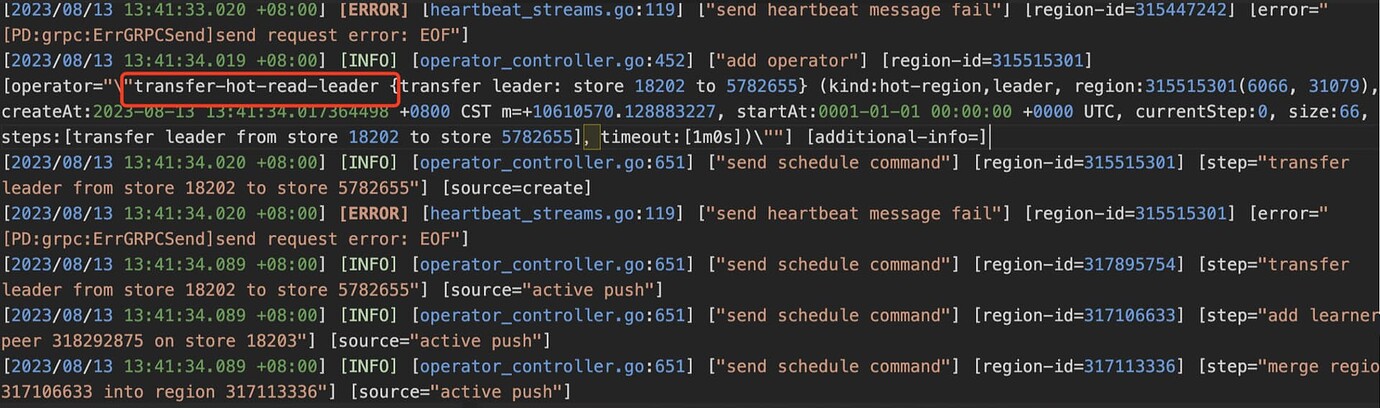
There are many schedule operator operations
PD logs show a lot of heartbeat timeout errors
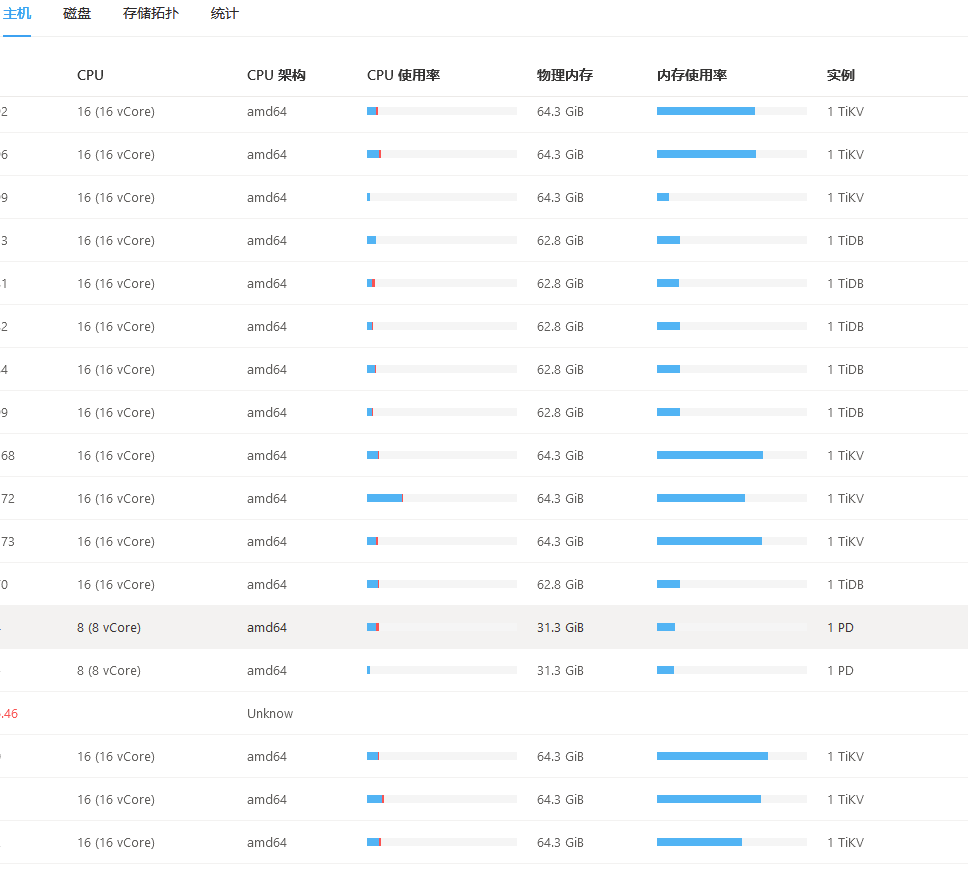
[Resource Configuration] Enter TiDB Dashboard - Cluster Info - Hosts and take a screenshot of this page
The link you provided leads to a Zhihu article. Please provide the specific text you need translated, and I will translate it for you.
Turn off swap, it’s better to let PD trigger OOM.
Why is there a significant increase in query load in monitoring? This could lead to the TiDB cluster needing more memory to handle query requests.
After encountering the issue, swap has been disabled. It is indeed better to let the program OOM directly, triggering an automatic leader switch.
It should be that after the failure, the business retries, generating more requests.
I’ll collect and take a look.
The issue has been resolved. The reason was that the priority of the faulty PD node was higher than that of the other nodes, preventing the leader from switching.
This topic was automatically closed 60 days after the last reply. New replies are no longer allowed.