Note:
This topic has been translated from a Chinese forum by GPT and might contain errors.
Original topic: pd节点异常下线,查看日志无明显error
[TiDB Usage Environment] Production Environment / Test / Poc
Production Environment
[TiDB Version]
5.2.1
[Reproduction Path] What operations were performed when the issue occurred
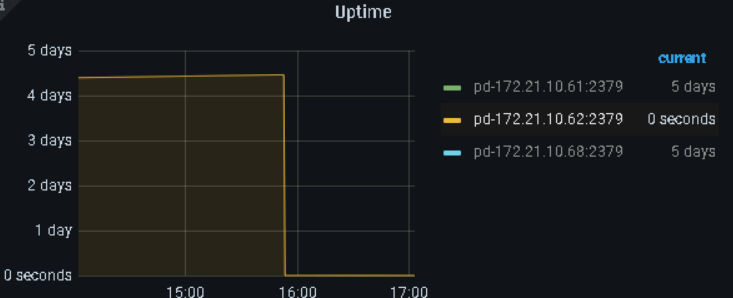
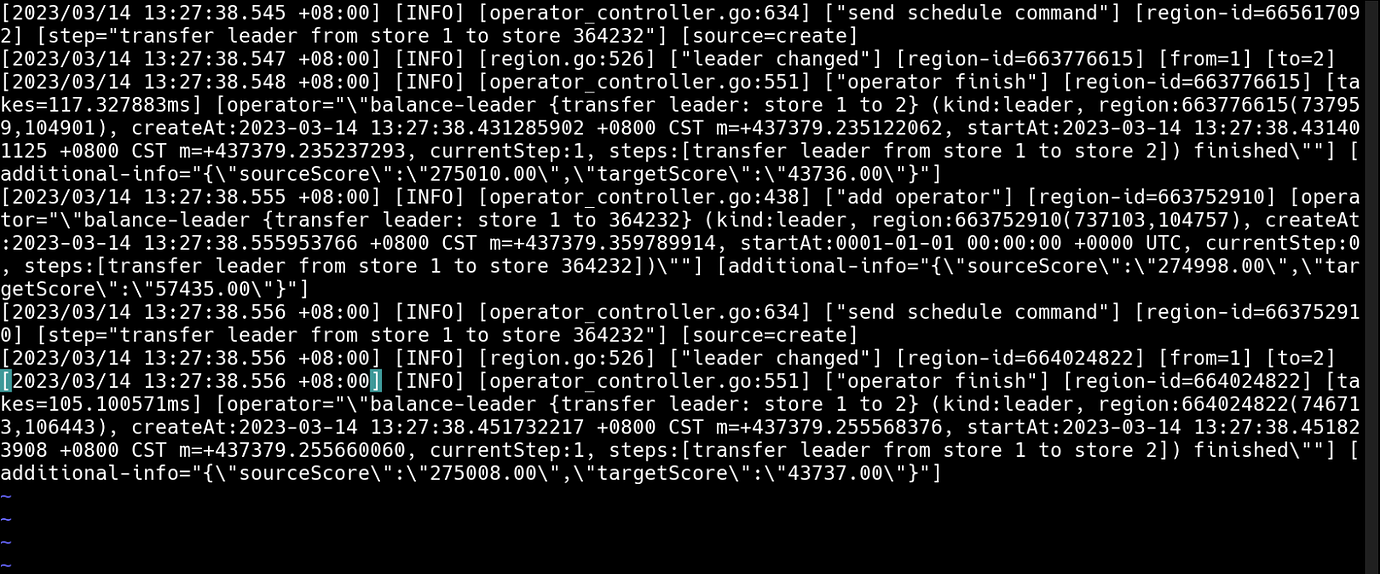
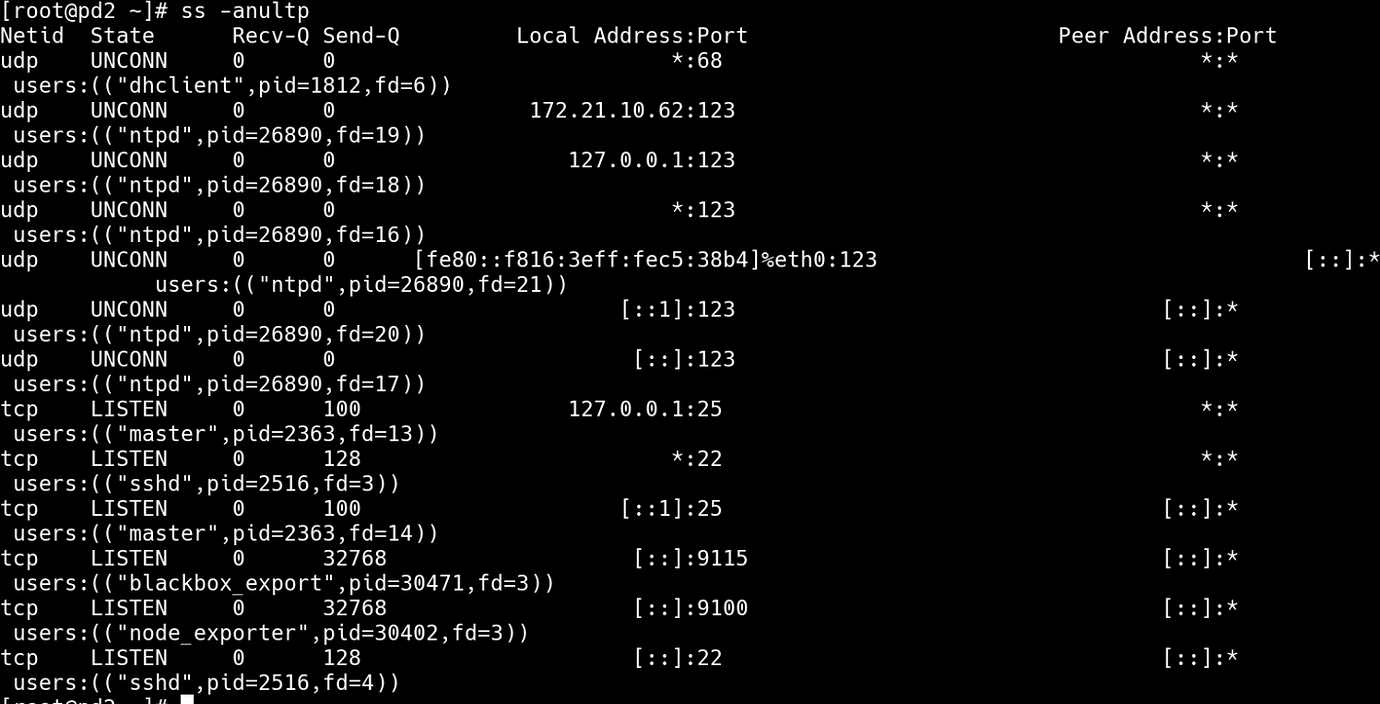
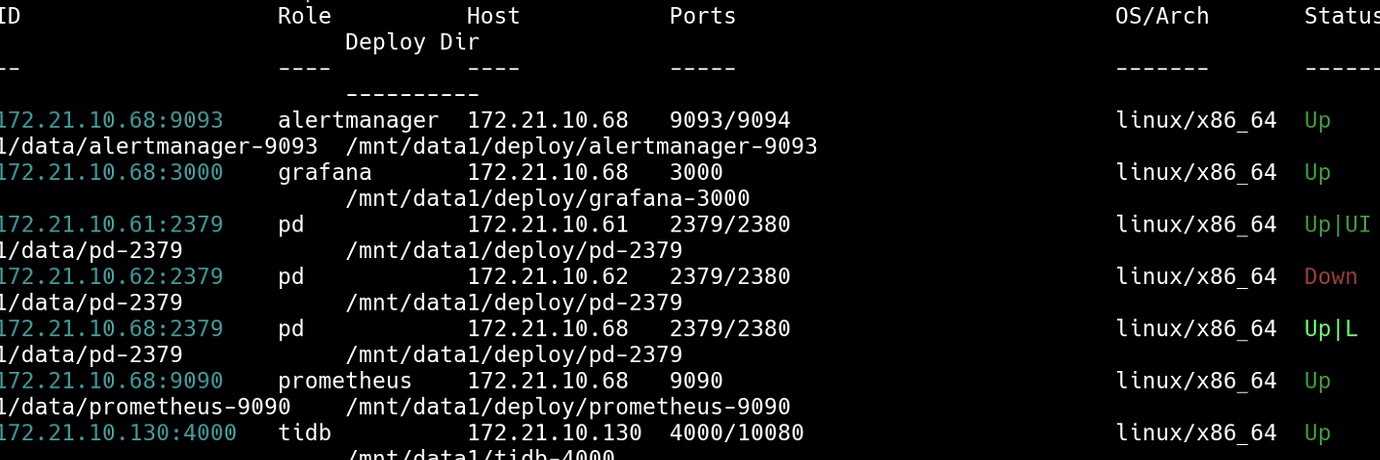
Around 4 PM, it was found that the PD node was in a down state, and there were no errors in the logs. Upon checking the server, the service had stopped directly.
[Encountered Issue: Issue Phenomenon and Impact]
[Resource Configuration]
[Attachments: Screenshots / Logs / Monitoring]
Is the final log only up to 13:27?
What about the OS logs?
It stops at around 1 o’clock. What do you mean by OS logs?
The /var/log/message on the downed PD node
I found the error, the disk is full 
Can this PD log be deleted? Also, should I restart PD in the form of scaling down and then scaling up?
Okay, thank you very much.
I have a question to ask. I have 3 nodes, and only the logs on this node are particularly large, while the logs on the other nodes are normal. Is there any rule for generating logs, or is it because this node is the leader? What else could affect the size of the PD logs? Just the logs for February alone are 200GB, which is more than the entire last year.