PD Node OOM

Note:
This topic has been translated from a Chinese forum by GPT and might contain errors.

Original topic: PD节点OOM

| username: wakaka

【TiDB Usage Environment】Production
【TiDB Version】5.0.6
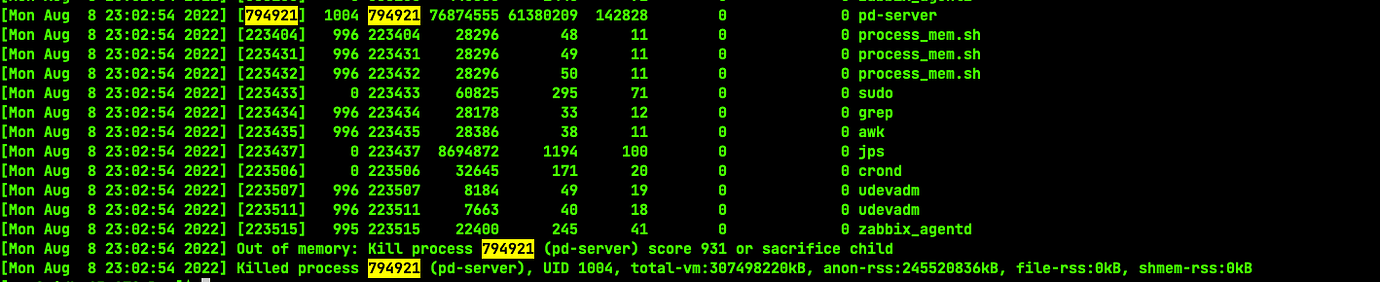
【Encountered Problem】A large number of truncate commands are stuck, causing the PD node to OOM
【Reproduction Path】What operations were performed to cause the problem

The TRUNCATE tasks in the ETL job are executing slowly, causing tasks to pile up.
【Problem Phenomenon and Impact】


The DDL that was stuck at the time is the same as the one in the picture below, just at a different time point.


【Attachments】

Please provide the version information of each component, such as cdc/tikv, which can be obtained by executing cdc version/tikv-server --version.

| username: xfworld | Original post link

First, provide the cluster information and related configuration details.

Then describe which nodes encountered issues and what problems occurred, ultimately leading to the PD issue?

| username: wakaka | Original post link

3 PD nodes 64c128g. 14 TiDB nodes 64c128g. 17 TiKV nodes 64c64g. 14 TiFlash nodes 64c64g.

| username: wakaka | Original post link

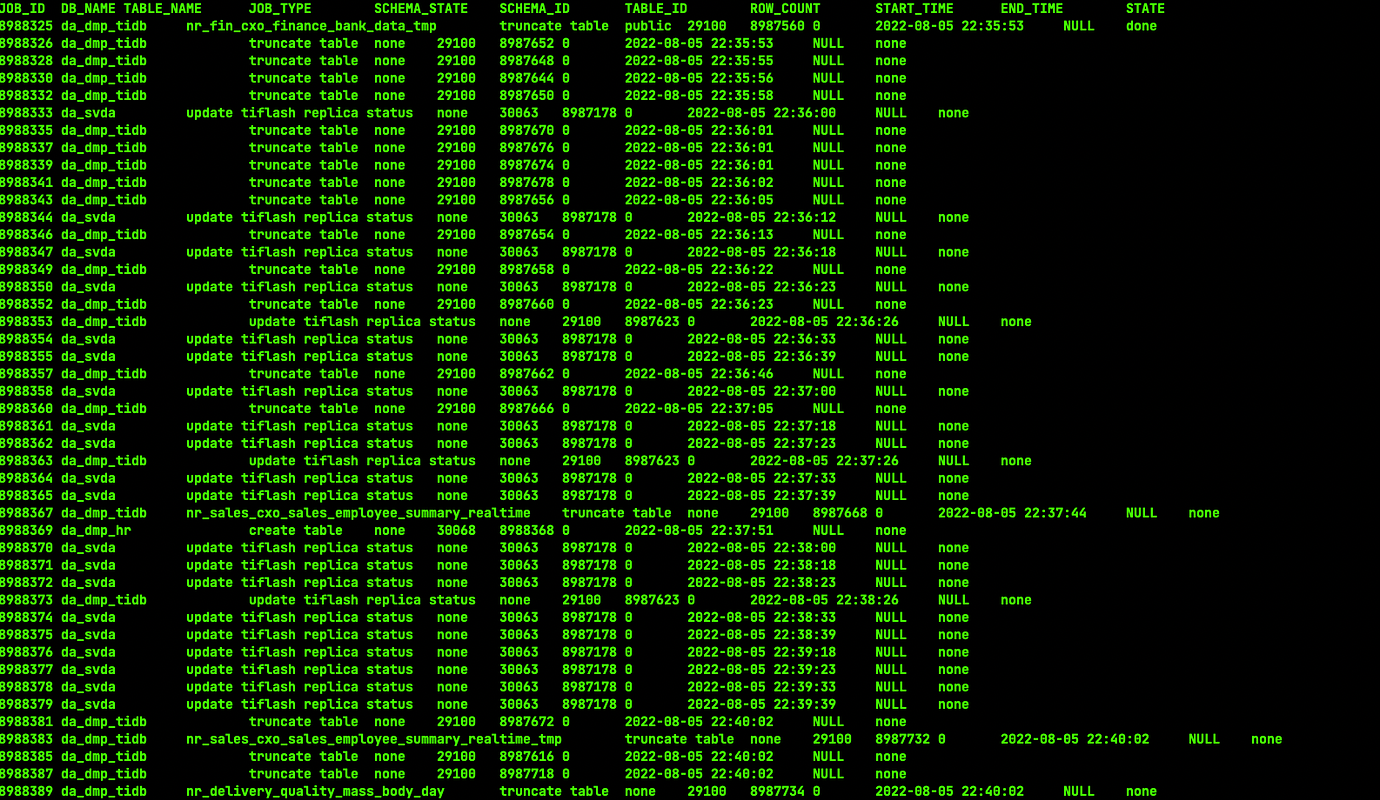
The business feedback indicates that the ETL scheduled task is stuck. The task first performs a truncate operation, then an insert operation. Running admin show ddl jobs shows hundreds of truncate and update TiFlash replica status operations.

| username: wakaka | Original post link

There doesn’t seem to be any major issues with the CPU and memory monitoring of TiDB, TiKV, and TiFlash nodes.

| username: wakaka | Original post link

This is a TiDB node.

| username: wakaka | Original post link

This is a PD node.

| username: wakaka | Original post link

TiFlash node

| username: wakaka | Original post link

TiKV node

| username: xfworld | Original post link

  1. Truncate is executed asynchronously. If truncate is not completed and an insert is executed, will it affect the business logic requirements?

  2. Considering your cluster is very large, is the number of regions also very large? Is the distribution even?

  3. The primary PD is under high pressure. Check if there are many empty regions as well? (It seems like it hasn’t been restarted for long)

| username: wakaka | Original post link

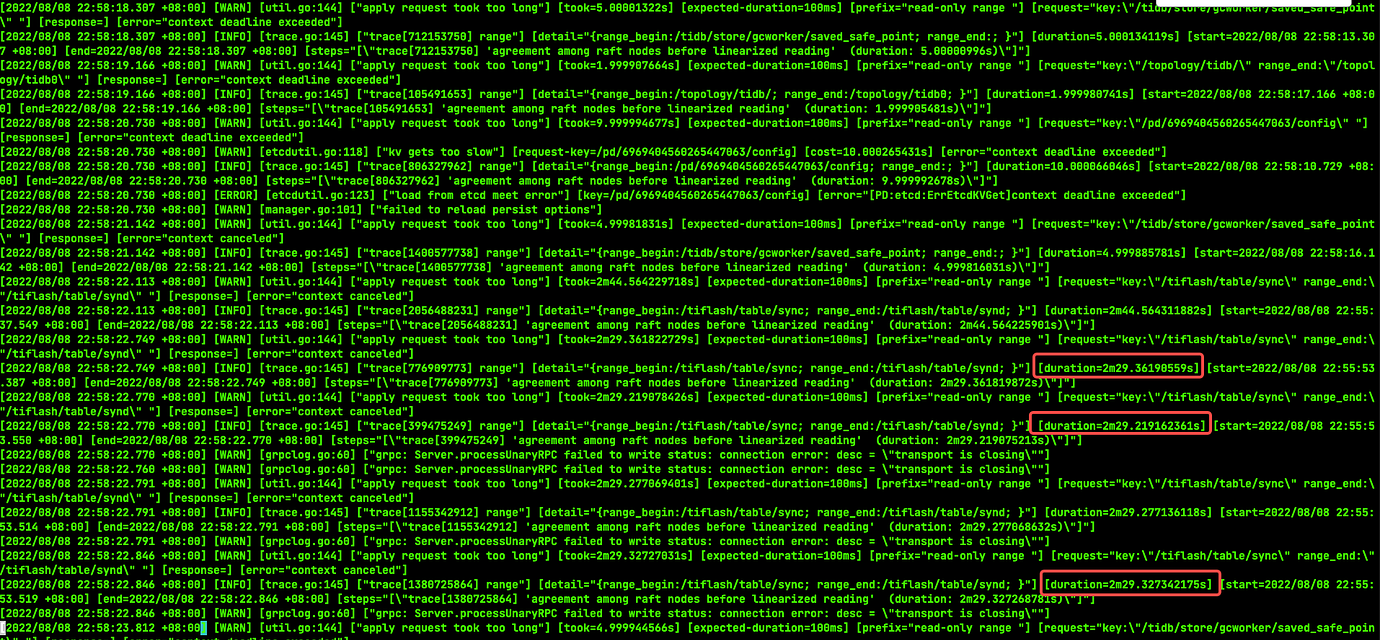
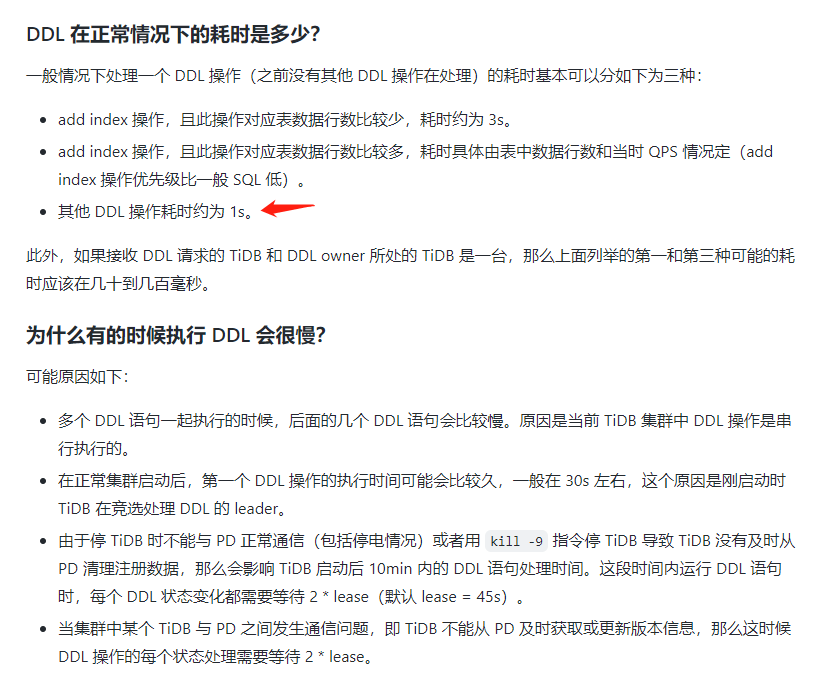
  1. The business layer is also being modified. Currently, it is unclear why truncate is so slow. Although it is asynchronous, it should still complete quickly. Normally, tables are processed within seconds. The slowness of truncate is causing issues with subsequent task retries.
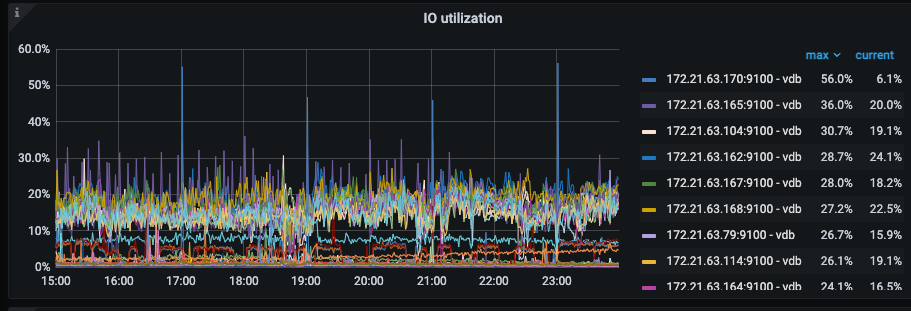
  2. There are over 1 million regions, and they appear to be balanced.
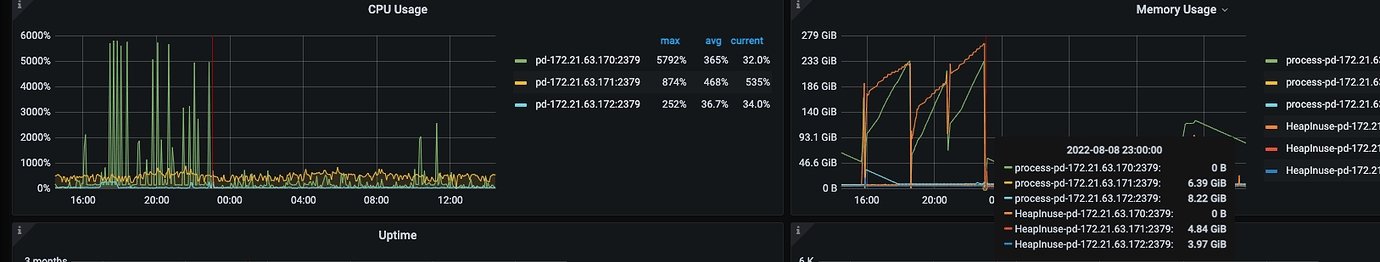
  3. The monitoring graphs are from August 8th, 15:00 to 23:59:59. The PD nodes restarted four times between 16:00 and 23:30.

Now, I want to know why truncate is slow and why PD’s memory usage is spiking.

| username: wakaka | Original post link

The tidb_gc_life_time parameter is used to control the GC (Garbage Collection) life cycle. The default value is 10m, which means that data older than 10 minutes will be cleaned up. You can adjust this parameter according to your needs.

| username: xfworld | Original post link

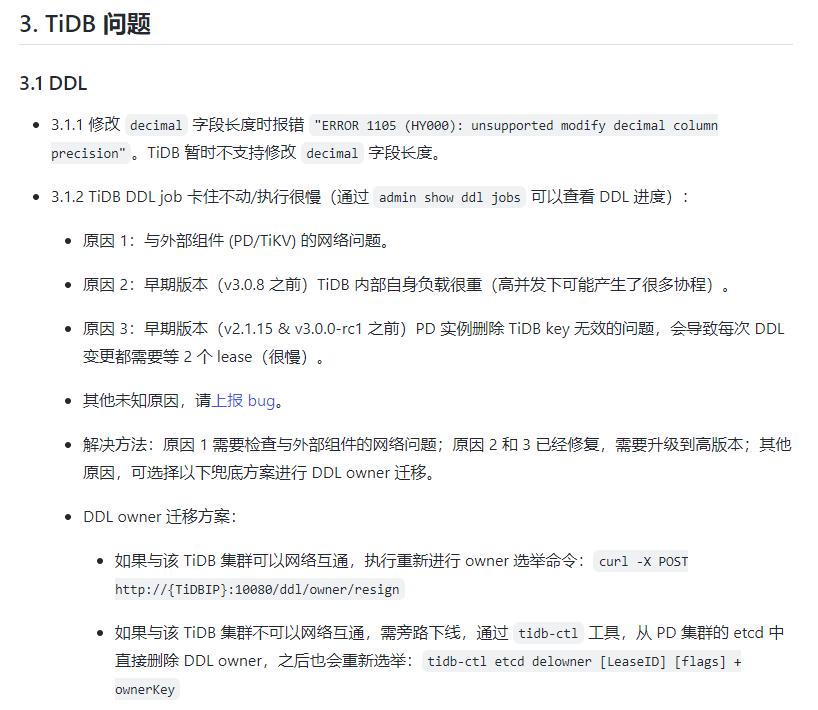
  1. The handling of truncate is executed by TiDB. Since it is asynchronous, it requires multiple status checks to execute successfully. To determine the speed, you need to check the status and records of each job execution.

  2. When the number of Regions is very large, it puts a heavy burden on PD because each Region needs to report its heartbeat and some information. It is recommended to refer to the optimization plan for a large number of Regions and optimize accordingly.

  3. Empty Regions also send heartbeats and information. It is recommended to perform quick merging.

For memory spikes, you need to manually collect data for analysis. Generating a flame graph should help identify the issue quickly.

| username: wakaka | Original post link

  1. How to check records? The admin show ddl jobs command shows the time, and many of them take 5 minutes or even 20 minutes to execute.
    2 and 3. I have just taken over this cluster and also plan to work on this area.
| username: wakaka | Original post link

This morning, the task was normal, and the PD memory wasn’t full (but it used 100GB), yet truncating still took 4 minutes.

| username: wakaka | Original post link

These have been running for more than 20 minutes.

| username: xfworld | Original post link

Is the amount of data in the table particularly large? And are there any anomalies in the IO of the KV nodes?

| username: wakaka | Original post link

Not much, the table ranges from a few thousand to tens of thousands of data.

| username: xfworld | Original post link

The handling of DDL is indeed very slow.

It is recommended to follow the points below for troubleshooting.

| username: h5n1 | Original post link

show variable like ‘tidb_scatter_region’ to check this parameter.