[TiDB Usage Environment] Production Environment
[TiDB Version]
v6.5.3
[Reproduction Path] What operations were performed when the issue occurred
Upgraded from 5.4.3 to 6.5.3
[Encountered Issue: Problem Phenomenon and Impact]
Machine load is normal, but previous SQL has become slower. The execution plan is the same, but the number of RPCs and RPC time have both increased. The overall time has increased from over 1 second to over 5 seconds.
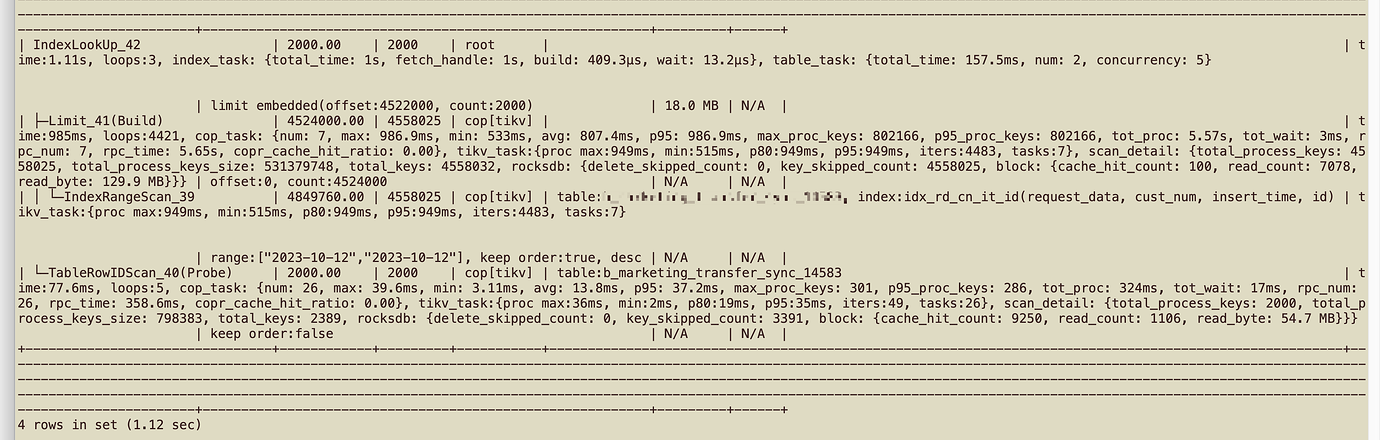
Old cluster 5.4.3: rpc_num: 7, rpc_time: 6.03s
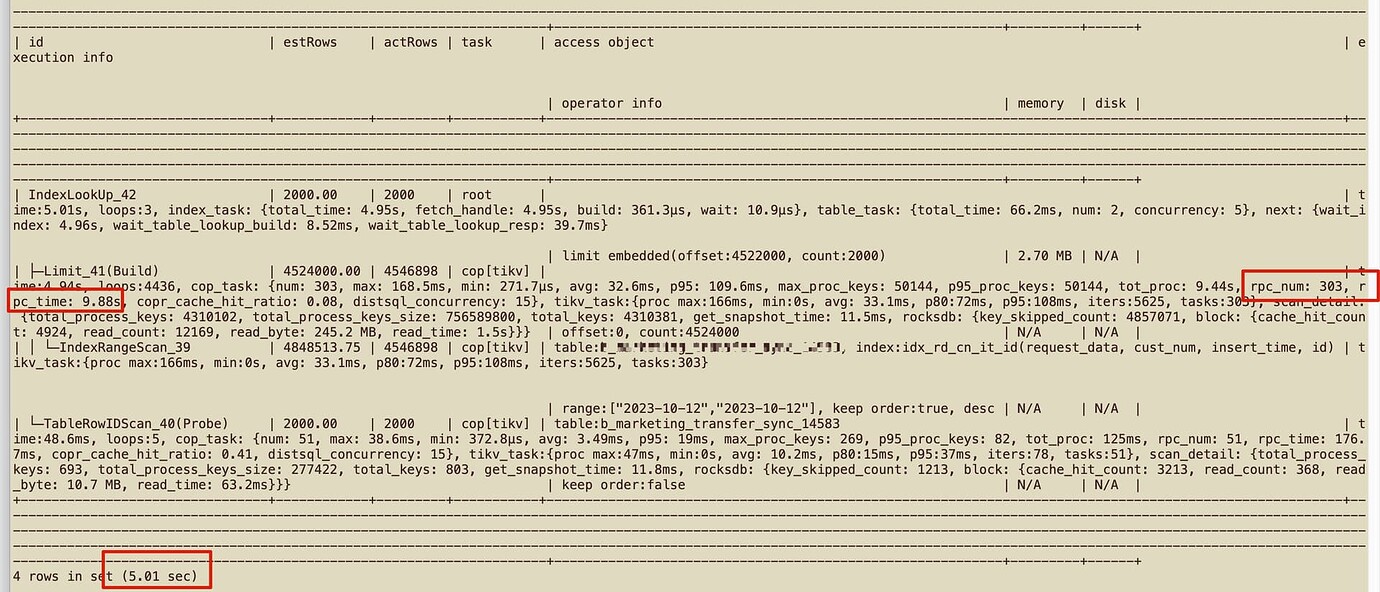
New cluster 6.5.3: rpc_num: 303, rpc_time: 12.5s
The rpc_num has increased significantly. How can this be optimized?
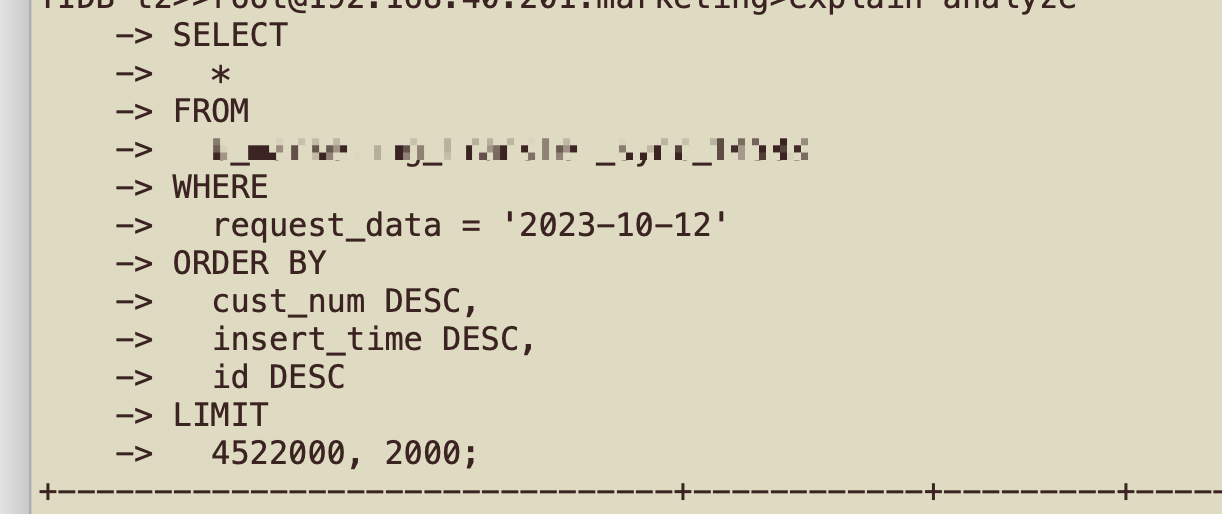
SQL statement:
Please share the machines and configurations of the two clusters. If there are different configurations and cluster situations, such differences might exist.
However, if you want to optimize and make it faster, you may need to provide more information.
Including: [Resource Configuration] Go to TiDB Dashboard - Cluster Info - Hosts and take a screenshot of this page
[Attachments: Screenshots/Logs/Monitoring]
In TiDB, rpc_num refers to the number of RPC (Remote Procedure Call) calls involved during the execution of SQL. RPC is a mechanism used for communication and data exchange between different nodes. rpc_time indicates the total time spent on RPC calls.
When rpc_num increases, it may lead to performance degradation because each RPC call incurs a certain time overhead. To optimize rpc_num, you can consider the following aspects:
Adjust TiDB Configuration Parameters: TiDB provides some configuration parameters related to RPC, which you can adjust based on actual conditions. For example, you can try adjusting the tidb_distsql_scan_concurrency parameter to control the number of concurrent scans, thereby reducing the number of RPC calls. You can refer to the relevant parameter descriptions in the TiDB configuration documentation for adjustments.
Optimize SQL Queries: Sometimes, the way SQL queries are written may lead to unnecessary RPC calls. By optimizing query statements, you can reduce unnecessary data transmission and computation, thereby reducing the number of RPC calls. You can use the EXPLAIN command to analyze the query plan, check for potential performance issues, and make corresponding optimizations.
Check Network Conditions: RPC calls involve network communication, and network latency and bandwidth limitations may increase RPC call time. You can check the network conditions to ensure stable network connections and sufficient network bandwidth between the TiDB cluster and other components.
Server performance differences:
The old cluster is relatively better, with 12 servers totaling 728 CPUs.
The new cluster is relatively worse, but not by much, with 12 servers totaling 632 CPUs.
Machines with version 6.5.3 have half of their performance being relatively poor, but they are only running one instance. Other machines are running two instances. The CPU has not reached its bottleneck, yet execution is still slow even when there is no business load.
It’s not about looking at the CPU bottleneck, but rather the differences in the CPU itself. I saw in another post that it was 5.4.3 sync → 6.5.3, and then your business switched to this 6.5.3. Is that the process? Did you compare the SQL performance differences before the upgrade?
There is a significant gap now, and there are others as well. It seems that the optimizer in version 6.5.3 has some issues. There was an SQL query this morning (https://asktug.com/t/topic/1014439/5) that also had problems. Even after running analyze, the issue persisted, but it was resolved after re-running analyze after some time. Besides this, there is another SQL query that is choosing the wrong index, but that doesn’t have a major impact.
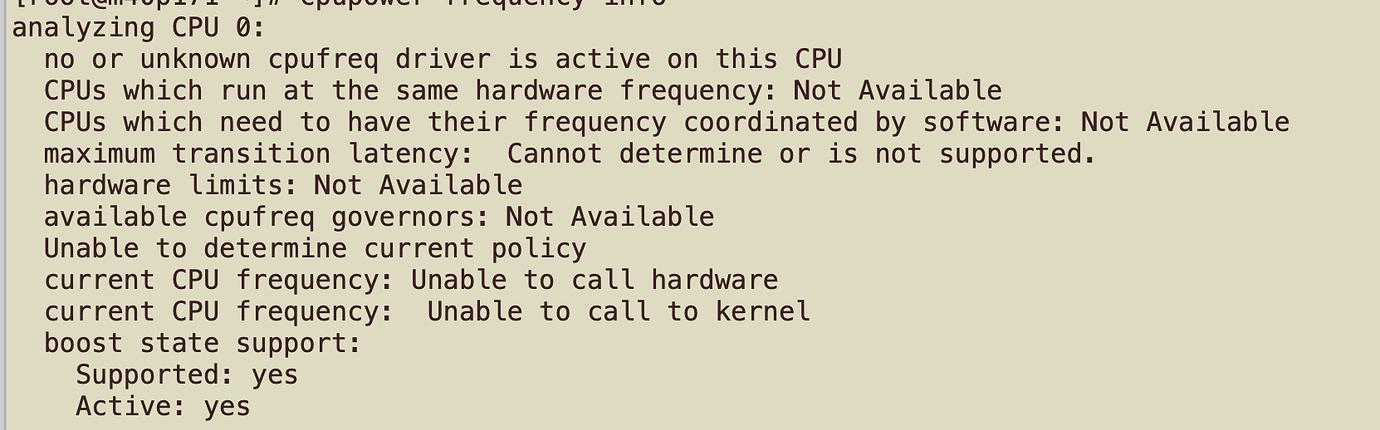
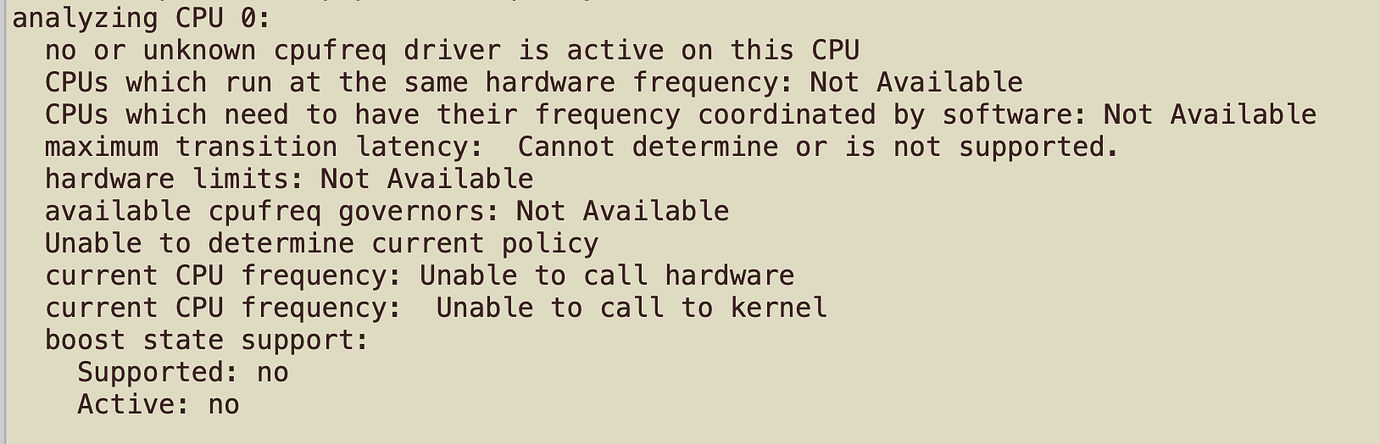
You can’t see the results. It looks like you might want to check if the CPU power-saving mode is enabled. A few days ago, there was another case where the overall performance slowed down after an upgrade, which was due to a GC issue. However, in his execution plan, you could clearly see the difference in the number of keys, whereas in your case, it’s relatively small. You can refer to this:
The system colleague checked and found that the CPU is in high-performance mode.
Version 5.4.3
scan_detail: {total_process_keys: 4558025, total_process_keys_size: 531379748, total_keys: 4558032
Version 6.5.3
scan_detail: {total_process_keys: 4087169, total_process_keys_size: 717849981, total_keys: 4087429,
The original cluster scanned 500,000 more keys.
Our master-slave GC is set to 24 hours.
In version 5.4, only 7 regions were accessed, while version 6.5 requires 303 regions. It is recommended to compact this table, find the region_id, and then write a script to process it in a loop. This will affect IO and take a considerable amount of time.