Note:
This topic has been translated from a Chinese forum by GPT and might contain errors.
Original topic: 压测持续写入时, 速度越来越慢
[Test Environment for TiDB]
[TiDB Version] 6.5.0
[Reproduction Path] Continuous writing to a table
[Encountered Problem: Phenomenon and Impact]
During stress testing, the speed is getting slower and slower, and I don’t know what the bottleneck is.
[Resource Configuration]
tidb: 8C32G SSD 300 G2
tipd: 8C16G SSD 300 G3
tikv: 16C32G SSD 1500 G *3
[Attachments: Screenshots/Logs/Monitoring]
Data is being written too quickly, and the disk write speed is relatively slow, causing the system to enter a write stall?
You should check the IO and KV logs.
When performing stress testing with continuous writes to TiDB, if the speed becomes increasingly slower, it may be due to various reasons. Here are some possible causes and solutions:
-
High load on TiKV nodes, causing slower write speeds. This can be alleviated by increasing the number of TiKV nodes or upgrading the configuration of TiKV nodes.
-
High write hotspots in TiDB, causing slower write speeds. This can be alleviated by adjusting the table structure or using TiDB’s built-in partition tables.
-
Lock contention during TiDB writes, causing slower write speeds. This can be alleviated by adjusting TiDB’s transaction isolation level or increasing the number of TiDB instances.
-
Slow queries during TiDB writes, causing slower write speeds. This can be alleviated by analyzing slow query logs to find the cause of the slow queries and optimizing them.
-
Disk IO bottlenecks during TiDB writes, causing slower write speeds. This can be alleviated by upgrading the disks or increasing the number of disks.
It is necessary to analyze and resolve the issue based on the specific situation. It is recommended to first use monitoring tools to check various metrics of the TiDB cluster, identify the problem, and then perform the corresponding optimization.
What tool did you use for the stress testing?
During the continuous writing process to a table, various bottlenecks may occur. Here are some possible bottlenecks and their solutions:
-
Hardware Resource Bottleneck: If the writing speed is getting slower, it may be due to insufficient hardware resources, such as disk, memory, CPU, etc. You can determine if there is a hardware resource bottleneck by monitoring system resource usage and consider upgrading hardware or optimizing system configuration.
-
Network Bottleneck: If the writing speed is getting slower, it may be due to insufficient network bandwidth or high network latency. You can determine if there is a network bottleneck by monitoring network bandwidth and latency and consider optimizing network configuration or upgrading network equipment.
-
Database Bottleneck: If the writing speed is getting slower, it may be due to a bottleneck in the database. For example, frequent write operations leading to lock contention, frequent write operations filling up the logs, or frequent write operations causing a drop in cache hit rate. You can determine if there is a database bottleneck by monitoring database performance indicators and consider optimizing database configuration or upgrading the database version.
-
Application Bottleneck: If the writing speed is getting slower, it may be due to a bottleneck in the application. For example, the way the application writes data is not efficient enough, or the concurrency of data writing in the application is not high enough. You can improve the writing speed by optimizing the application code.
In summary, it is necessary to determine the bottleneck based on the specific situation and take corresponding measures to solve the problem.
Without using tools, directly write a program to simulate the write logic of the production environment.
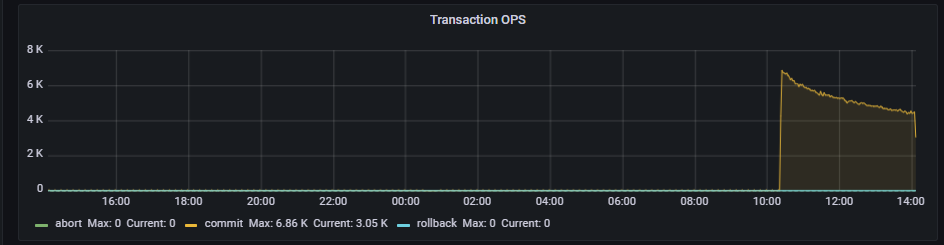
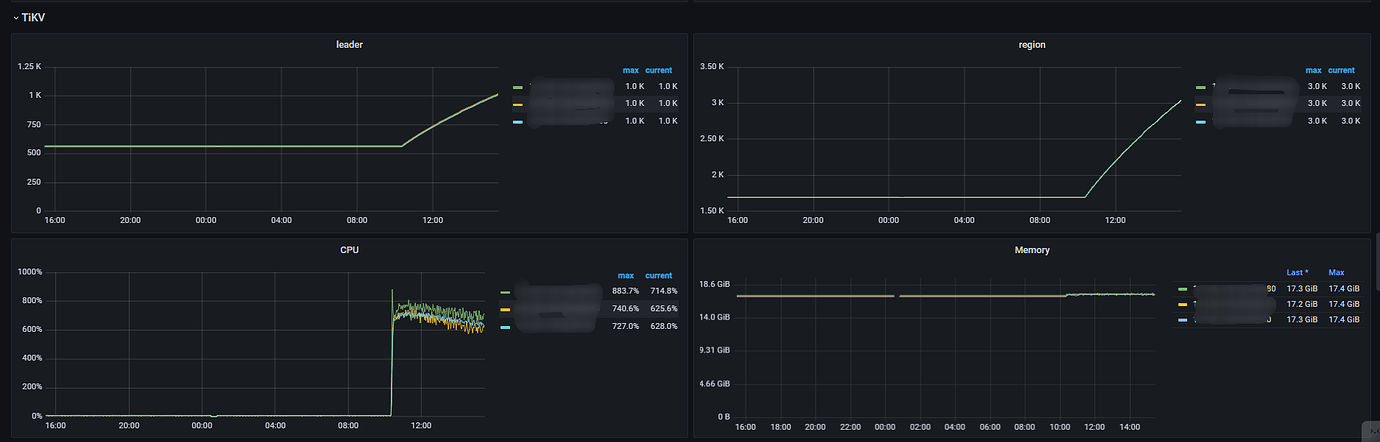
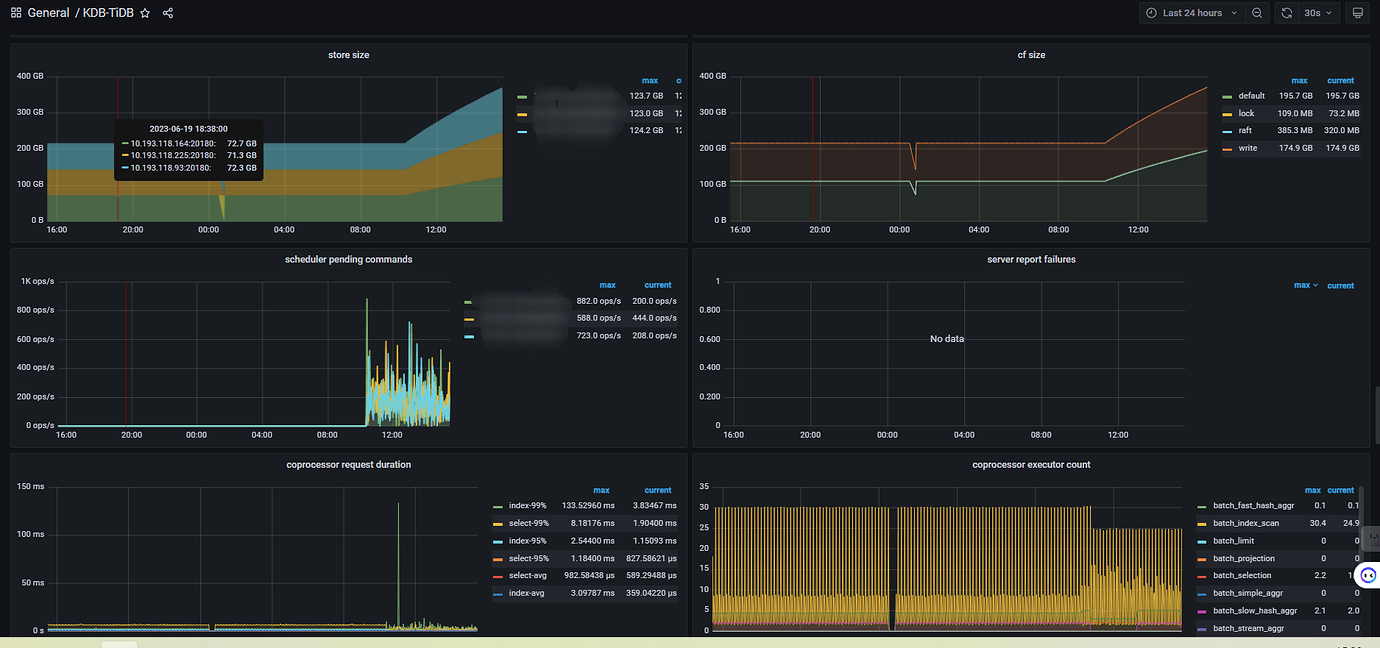
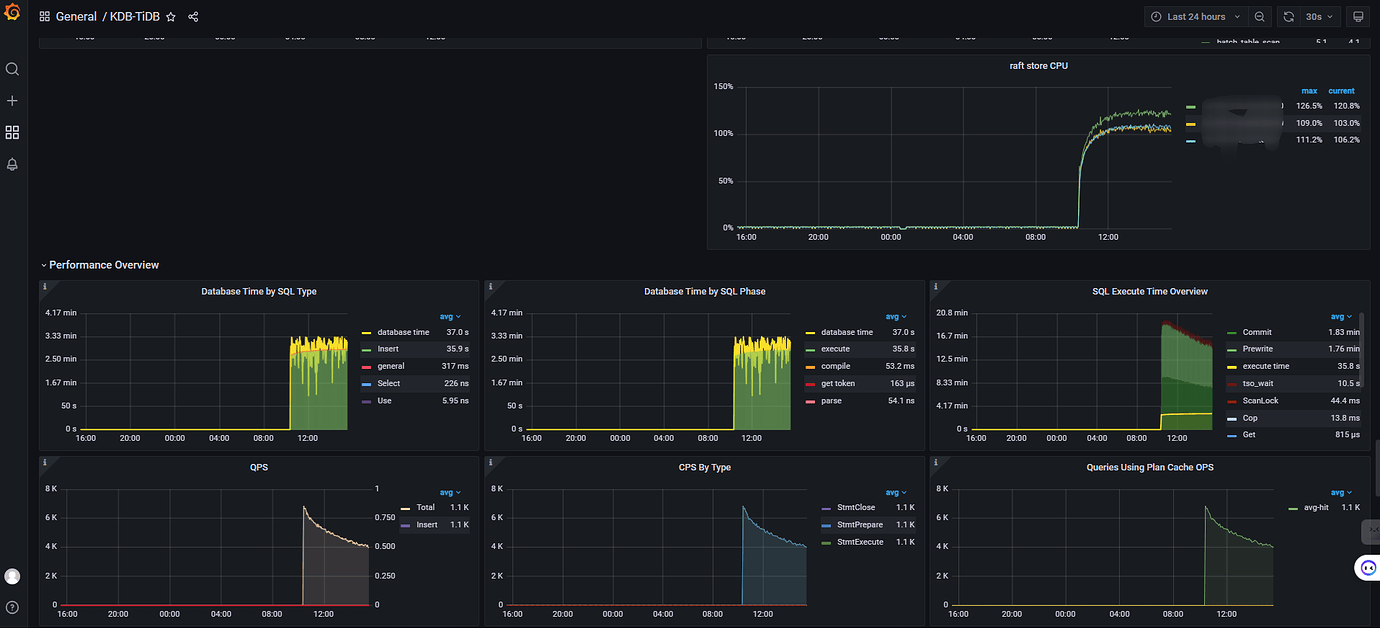
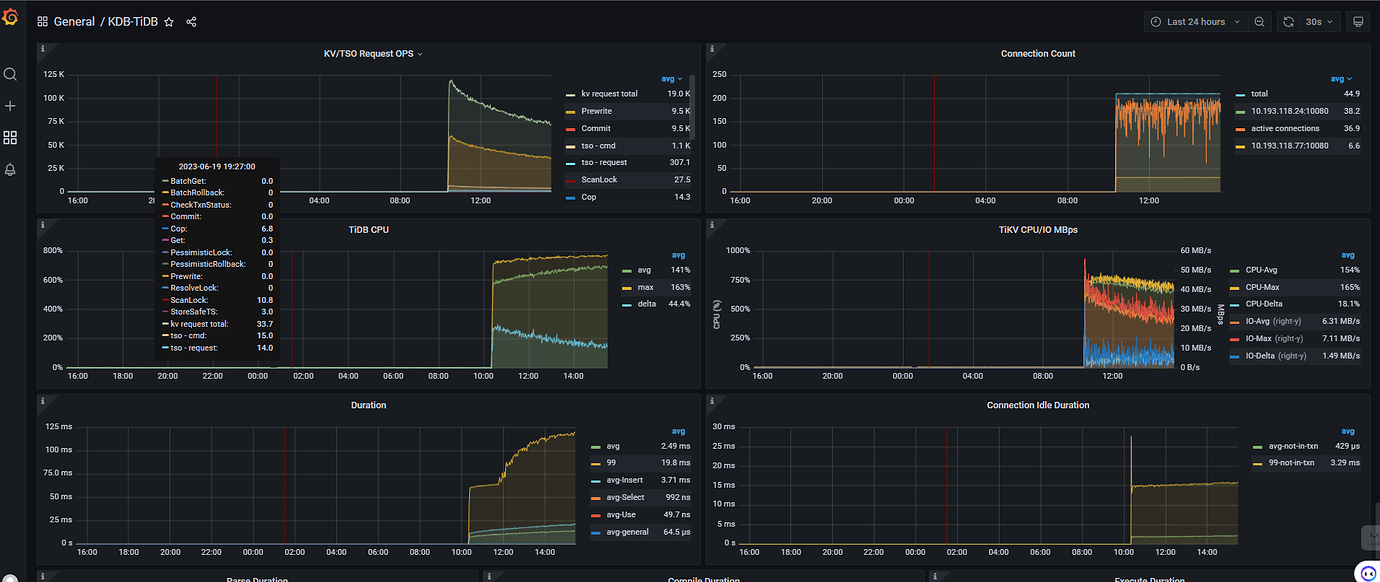
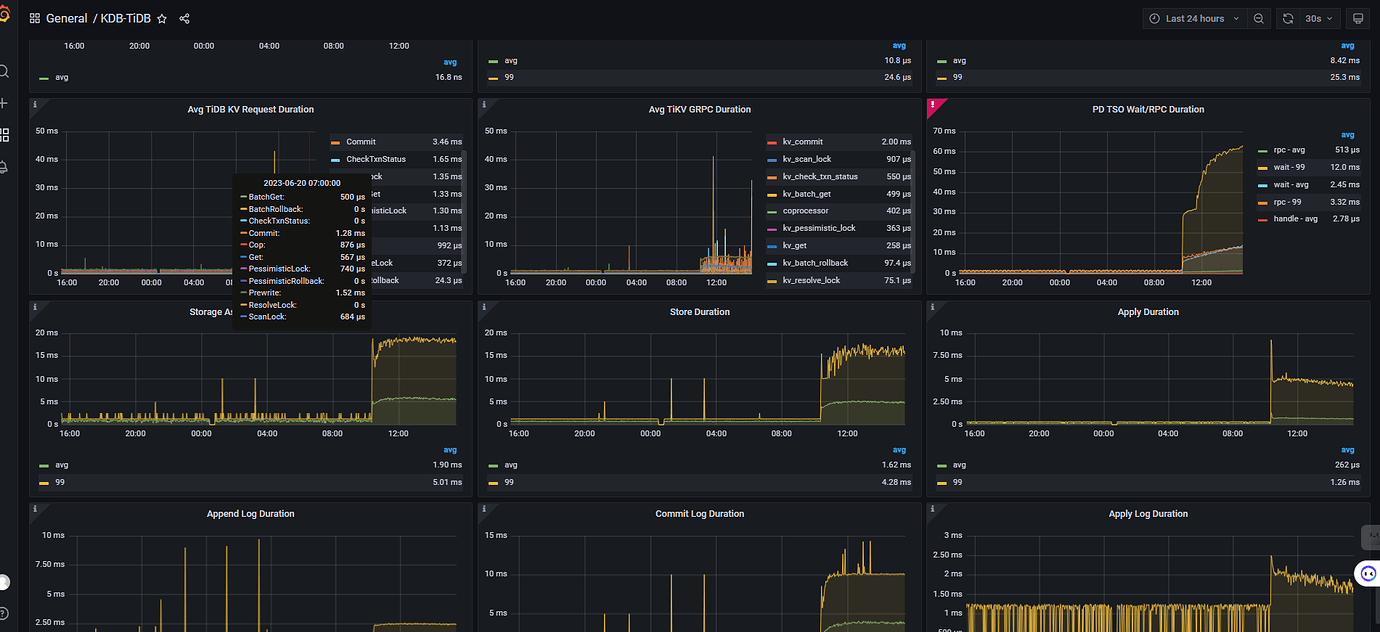
Added some monitoring images, any thoughts?
I can provide some rough ideas and my own observations. I can’t offer detailed insights.
I haven’t seen such detailed graphs as you have. I just looked at this graph in the TiDB dashboard.
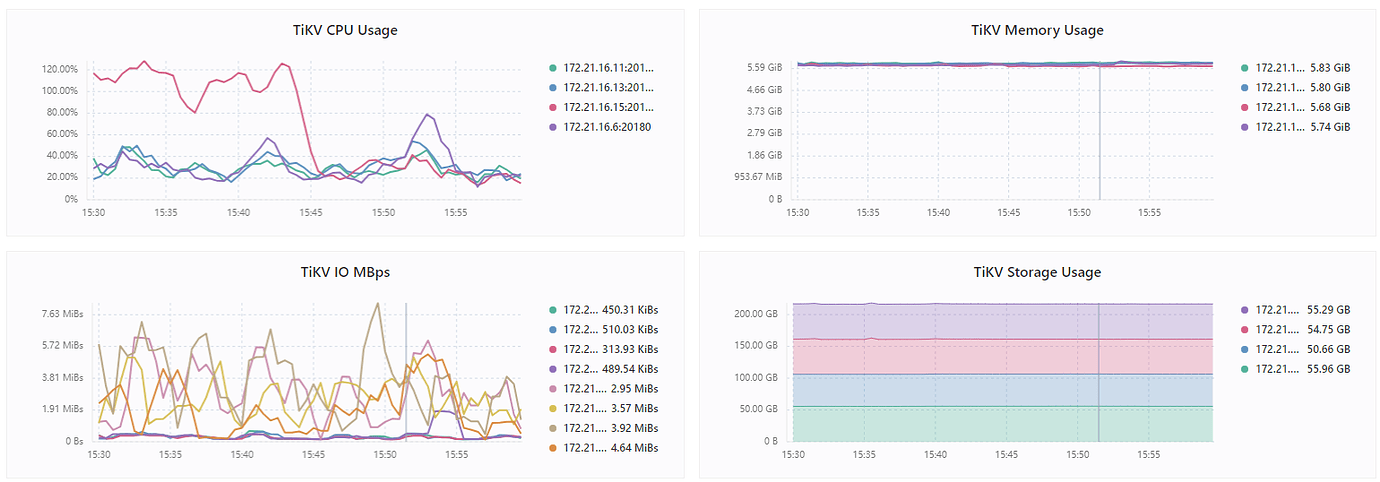
On my side, both TiDB and TiKV are 4C8G. 2 TiDB and 4 TiKV. During continuous import, each CPU of the 4 TiKV can reach 380%. Each CPU of the 2 TiDB can barely reach 1-200%. TiKV IO is only around 30M. Although this storage is poor, it can at least reach around 150M for read and write.
So for my own cluster, the bottleneck is on the TiKV CPU.
But to break it down further and look at those metrics, I’m not sure. 
My skills are limited. Just throwing out some ideas to get the ball rolling. I’ll also wait and see if there are any further observation methods.
Also consider whether the SSD has a cache; if the cache is exhausted, it will significantly affect the speed.
This is consistent with the pattern, it’s just a matter of the rate of decline.
As the stored data increases, the resources consumed will also increase, the server load will become higher, and the write speed will definitely slow down.
Other databases probably have this situation as well, so it should be considered normal.