Note:
This topic has been translated from a Chinese forum by GPT and might contain errors.Original topic: performance监控大屏展示快速了解故障、集群运行状态
[TiDB Usage Environment] Production Environment
[TiDB Version] 6.5
[Reproduction Path] What operations were performed when the issue occurred
[Encountered Issue: Issue Phenomenon and Impact]
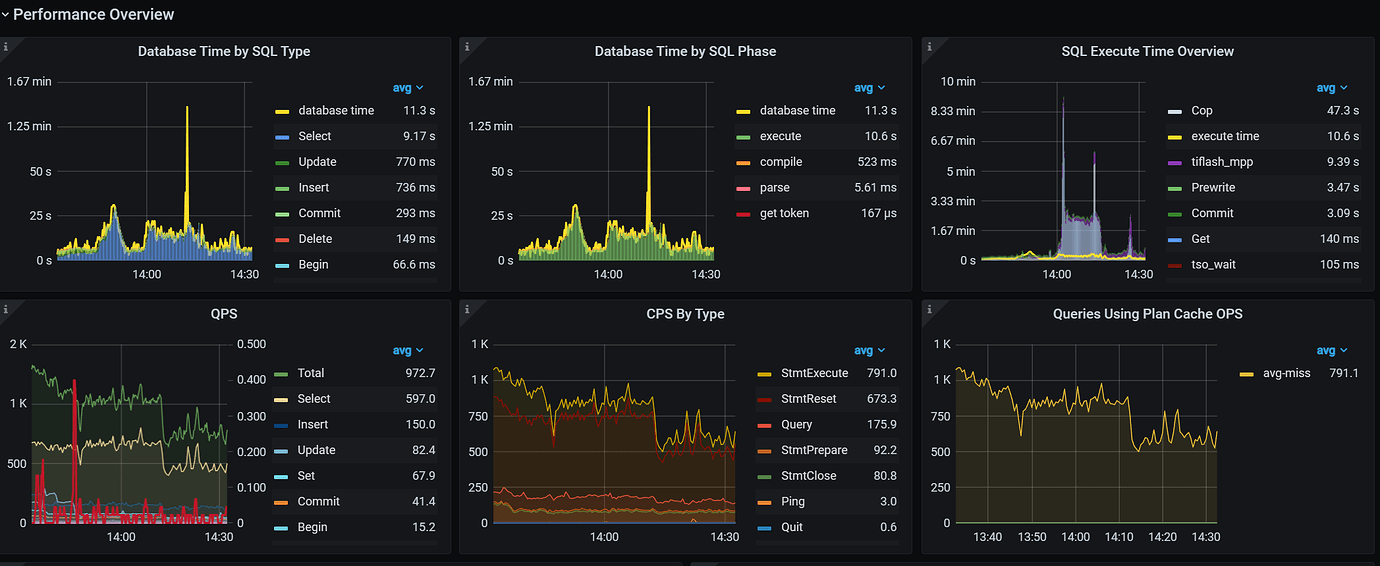
The big screen displays various graphs, which are very cool. However, during use, it is only checked when there is a problem. When checking, the goal is to locate and solve the issue. We want to know if a certain node is down or if a certain SQL execution is causing high CPU usage.
The current monitoring screen does not allow one to immediately identify the database issue, and it is even difficult to speculate where the problem might be.
I would like to ask if any experts have optimized the Prometheus view to make it more intuitive to understand the running status.
Or if there are any summarized common fault parameters that have been displayed in real-time.
[Resource Configuration] Enter TiDB Dashboard - Cluster Info - Hosts and take a screenshot of this page
[Attachment: Screenshot/Log/Monitoring]