Note:
This topic has been translated from a Chinese forum by GPT and might contain errors.Original topic: Tikv进行性能测试,性能逐渐下降
To improve efficiency, please provide the following information. Clear problem descriptions can be resolved faster:
[TiDB Usage Environment]
Architecture: x86_64
CPU op-mode(s): 32-bit, 64-bit
Byte Order: Little Endian
CPU(s): 88
On-line CPU(s) list: 0-87
Thread(s) per core: 2
Core(s) per socket: 22
Socket(s): 2
NUMA node(s): 2
Vendor ID: GenuineIntel
CPU family: 6
Model: 85
Model name: Intel(R) Xeon(R) Gold 6152 CPU @ 2.10GHz
Stepping: 4
CPU MHz: 2800.109
CPU max MHz: 3700.0000
CPU min MHz: 1000.0000
BogoMIPS: 4200.00
Virtualization: VT-x
L1d cache: 32K
L1i cache: 32K
L2 cache: 1024K
L3 cache: 30976K
NUMA node0 CPU(s): 0-21,44-65
NUMA node1 CPU(s): 22-43,66-87
total used free shared buff/cache available
Mem: 125 15 3 0 105 106
Swap: 0 0 0
Configuration of the three machines as above
[Overview] Scenario + Problem Overview
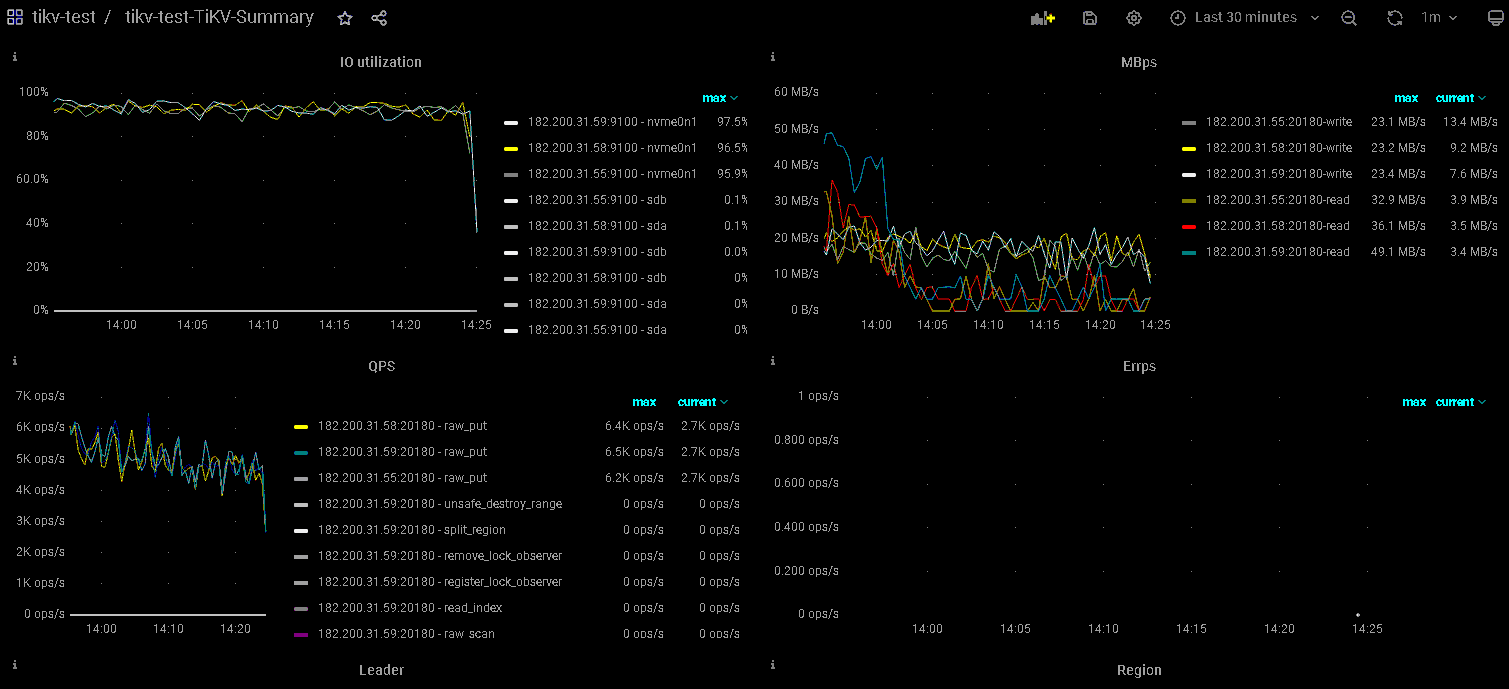
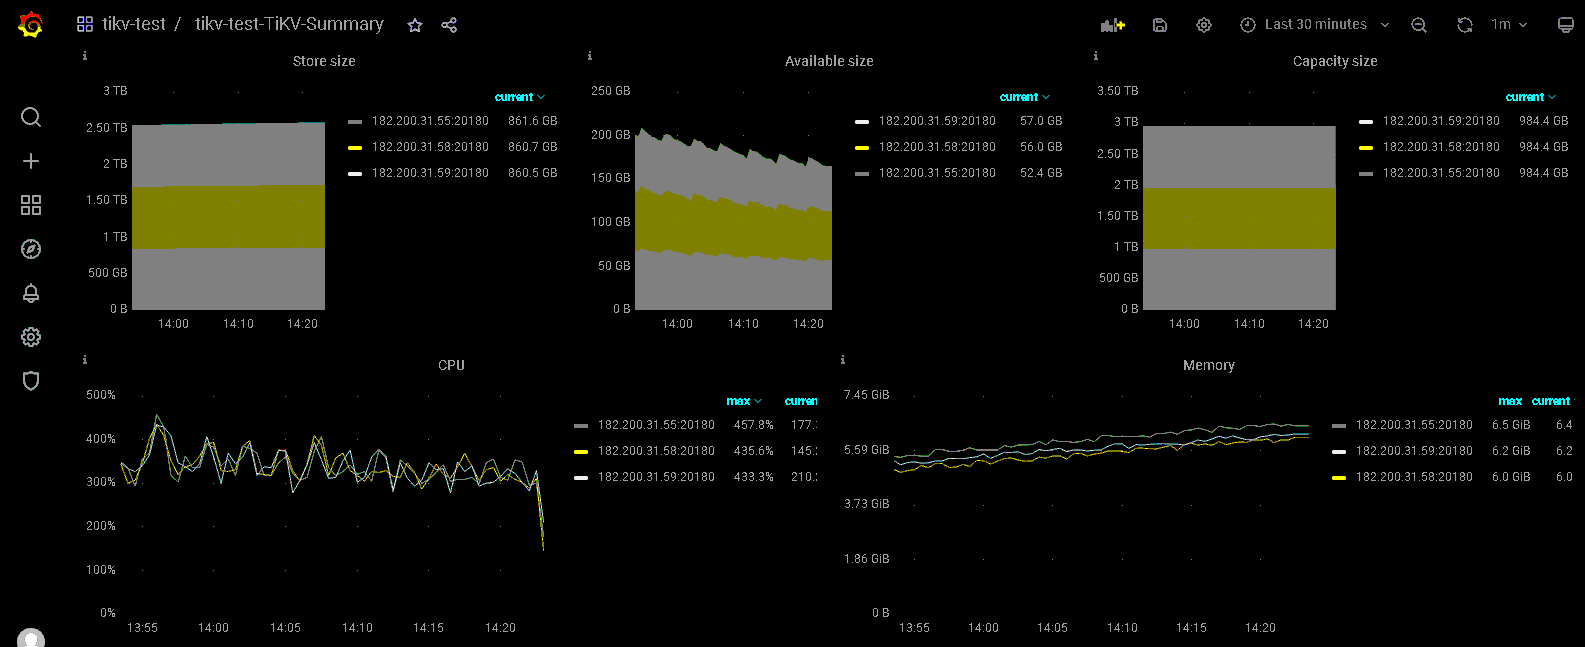
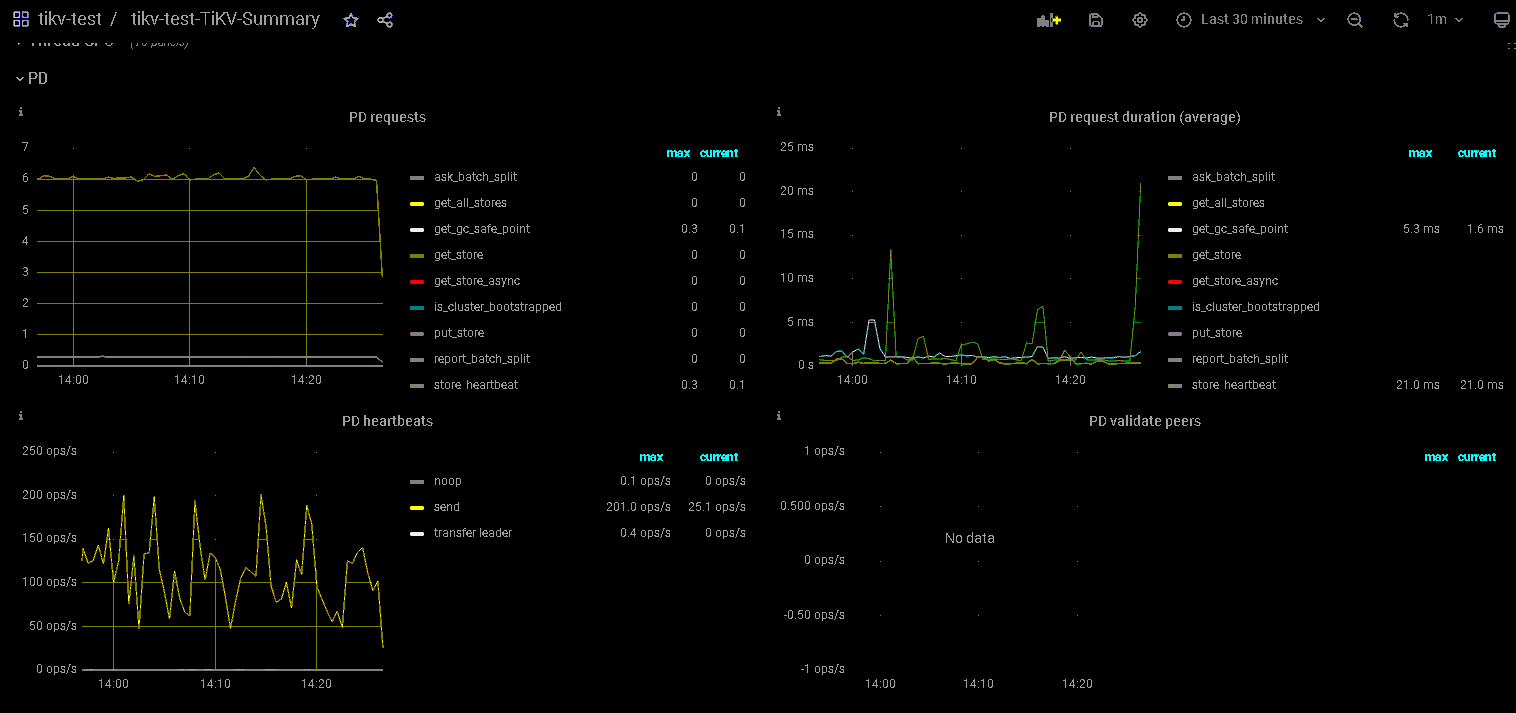
Establish a TiKV cluster using the above three machines, then use go-ycsb for performance testing. The goal is to insert 10 billion records. During the test, it was found that the performance of TiKV gradually decreased.
[Background] Operations performed
./bin/go-ycsb load tikv -P workloads/workloadc -p dropdata=false -p verbose=false -p debug.pprof=“:6060” -p tikv.pd=“182.200.31.55:2379” -p tikv.type=“raw” -p tikv.conncount=128 -p tikv.batchsize=128 -p operationcount=10000000000 -p recordcount=10000000000 -p threadcount=500
[Phenomenon] Business and database phenomena
go-ycsb stress testing
[Problem] Current issues encountered
Significant performance degradation
[Business Impact]
[TiKV Version]
5.4.0
[Application Software and Version]
[Attachments] Relevant logs and configuration information
[root@rdma55 /]# tiup cluster display tikv-test
tiup is checking updates for component cluster …
Starting component cluster: /root/.tiup/components/cluster/v1.9.0/tiup-cluster /root/.tiup/components/cluster/v1.9.0/tiup-cluster display tikv-test
Cluster type: tidb
Cluster name: tikv-test
Cluster version: v5.4.0
Deploy user: tikv
SSH type: builtin
Dashboard URL: http://182.200.31.55:2379/dashboard
ID Role Host Ports OS/Arch Status Data Dir Deploy Dir
182.200.31.55:9093 alertmanager 182.200.31.55 9093/9094 linux/x86_64 Up /data_tikv/tikv-data/alertmanager-9093 /data_tikv/tikv-deploy/alertmanager-9093
182.200.31.55:3000 grafana 182.200.31.55 3000 linux/x86_64 Up - /data_tikv/tikv-deploy/grafana-3000
182.200.31.55:2379 pd 182.200.31.55 2379/2380 linux/x86_64 Up|L|UI /data_tikv/tikv-data/pd-2379 /data_tikv/tikv-deploy/pd-2379
182.200.31.58:2379 pd 182.200.31.58 2379/2380 linux/x86_64 Up /data_tikv/tikv-data/pd-2379 /data_tikv/tikv-deploy/pd-2379
182.200.31.59:2379 pd 182.200.31.59 2379/2380 linux/x86_64 Up /data_tikv/tikv-data/pd-2379 /data_tikv/tikv-deploy/pd-2379
182.200.31.55:9090 prometheus 182.200.31.55 9090/12020 linux/x86_64 Up /data_tikv/tikv-data/prometheus-8249 /data_tikv/tikv-deploy/prometheus-8249
182.200.31.55:20160 tikv 182.200.31.55 20160/20180 linux/x86_64 Up /data_tikv/tikv-data/tikv-20160 /data_tikv/tikv-deploy/tikv-4000
182.200.31.58:20160 tikv 182.200.31.58 20160/20180 linux/x86_64 Up /data_tikv/tikv-data/tikv-20160 /data_tikv/tikv-deploy/tikv-4000
182.200.31.59:20160 tikv 182.200.31.59 20160/20180 linux/x86_64 Up /data_tikv/tikv-data/tikv-20160 /data_tikv/tikv-deploy/tikv-4000
Total nodes: 9
- TiUP Cluster Edit config information
global:
user: tikv
ssh_port: 22
ssh_type: builtin
deploy_dir: /data_tikv/tikv-deploy
data_dir: /data_tikv/tikv-data
os: linux
arch: amd64
monitored:
node_exporter_port: 9100
blackbox_exporter_port: 9115
deploy_dir: /data_tikv/tikv-deploy/monitor-9100
data_dir: /data_tikv/tikv-data/monitor-9100
log_dir: /data_tikv/tikv-deploy/monitor-9100/log
tidb_servers:
tikv_servers:
- host: 182.200.31.55
ssh_port: 22
port: 20160
status_port: 20180
deploy_dir: /data_tikv/tikv-deploy/tikv-4000
data_dir: /data_tikv/tikv-data/tikv-20160
log_dir: /data_tikv/tikv-deploy/tikv-4000/log
arch: amd64
os: linux - host: 182.200.31.58
ssh_port: 22
port: 20160
status_port: 20180
deploy_dir: /data_tikv/tikv-deploy/tikv-4000
data_dir: /data_tikv/tikv-data/tikv-20160
log_dir: /data_tikv/tikv-deploy/tikv-4000/log
arch: amd64
os: linux - host: 182.200.31.59
ssh_port: 22
port: 20160
status_port: 20180
deploy_dir: /data_tikv/tikv-deploy/tikv-4000
data_dir: /data_tikv/tikv-data/tikv-20160
log_dir: /data_tikv/tikv-deploy/tikv-4000/log
arch: amd64
os: linux
tiflash_servers:
pd_servers: - host: 182.200.31.55
ssh_port: 22
name: pd-182.200.31.55-2379
client_port: 2379
peer_port: 2380
deploy_dir: /data_tikv/tikv-deploy/pd-2379
data_dir: /data_tikv/tikv-data/pd-2379
log_dir: /data_tikv/tikv-deploy/pd-2379/log
arch: amd64
os: linux - host: 182.200.31.58
ssh_port: 22
name: pd-182.200.31.58-2379
client_port: 2379
peer_port: 2380
deploy_dir: /data_tikv/tikv-deploy/pd-2379
data_dir: /data_tikv/tikv-data/pd-2379
log_dir: /data_tikv/tikv-deploy/pd-2379/log
arch: amd64
os: linux - host: 182.200.31.59
ssh_port: 22
name: pd-182.200.31.59-2379
client_port: 2379
peer_port: 2380
deploy_dir: /data_tikv/tikv-deploy/pd-2379
data_dir: /data_tikv/tikv-data/pd-2379
log_dir: /data_tikv/tikv-deploy/pd-2379/log
arch: amd64
os: linux
monitoring_servers: - host: 182.200.31.55
ssh_port: 22
port: 9090
ng_port: 12020
deploy_dir: /data_tikv/tikv-deploy/prometheus-8249
data_dir: /data_tikv/tikv-data/prometheus-8249
log_dir: /data_tikv/tikv-deploy/prometheus-8249/log
external_alertmanagers:
arch: amd64
os: linux
grafana_servers: - host: 182.200.31.55
ssh_port: 22
port: 3000
deploy_dir: /data_tikv/tikv-deploy/grafana-3000
arch: amd64
os: linux
username: admin
password: admin
anonymous_enable: false
root_url: “”
domain: “”
alertmanager_servers: - host: 182.200.31.55
ssh_port: 22
web_port: 9093
cluster_port: 9094
deploy_dir: /data_tikv/tikv-deploy/alertmanager-9093
data_dir: /data_tikv/tikv-data/alertmanager-9093
log_dir: /data_tikv/tikv-deploy/alertmanager-9094/log
arch: amd64
os: linux
Monitoring (https://metricstool.pingcap.com/)
- TiDB-Overview Grafana monitoring
- TiDB Grafana monitoring
- TiKV Grafana monitoring
- PD Grafana monitoring
- Corresponding module logs (including logs 1 hour before and after the issue)
If the question is about performance optimization or troubleshooting, please download the script and run it. Please select all and copy-paste the terminal output results for upload.