Note:
This topic has been translated from a Chinese forum by GPT and might contain errors.
Original topic: TiDB-server 内存监控 间歇性降为0,是哪些可能得原因导致的
[TiDB Usage Environment] Production Environment
[TiDB Version] 6.5.1
[Reproduction Path]
Single SQL query limit: global.tidb_mem_quota_query = 40G;
TiDB server memory limit: global.tidb_server_memory_limit = ‘80%’;
tidb_server_memory_limit_gc_trigger 0.7
[Encountered Problem: Phenomenon and Impact]
TiDB total memory is 160G, TiDB-server memory limit is tidb_server_memory_limit=138G.
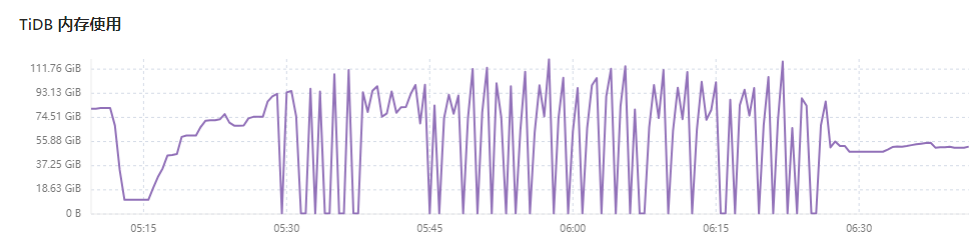
When checking TiDB-Server memory monitoring, it intermittently drops to 0.
Additionally, the single SQL query limit is 40G. During the monitoring period, only one task is running on TiDB-Server. Why does TiDB-Server memory monitoring show usage around 90G?
When checking TiDB-Server uptime, it also intermittently drops to 0, but the total uptime continues.

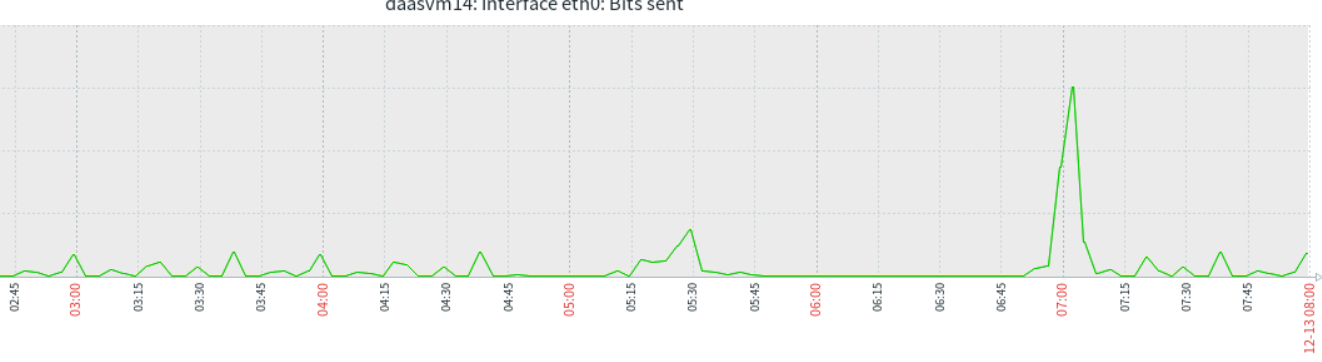
When checking the network communication of the TiDB-server node, the communication is normal, and no traffic is sent during the corresponding period.
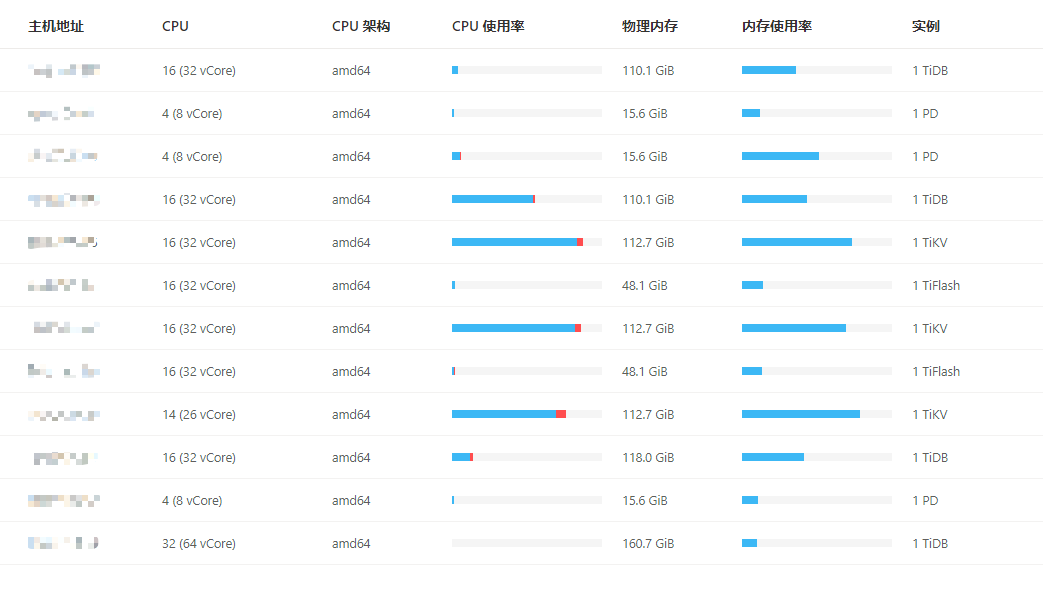
[Resource Configuration] Go to TiDB Dashboard - Cluster Info - Hosts and take a screenshot of this page
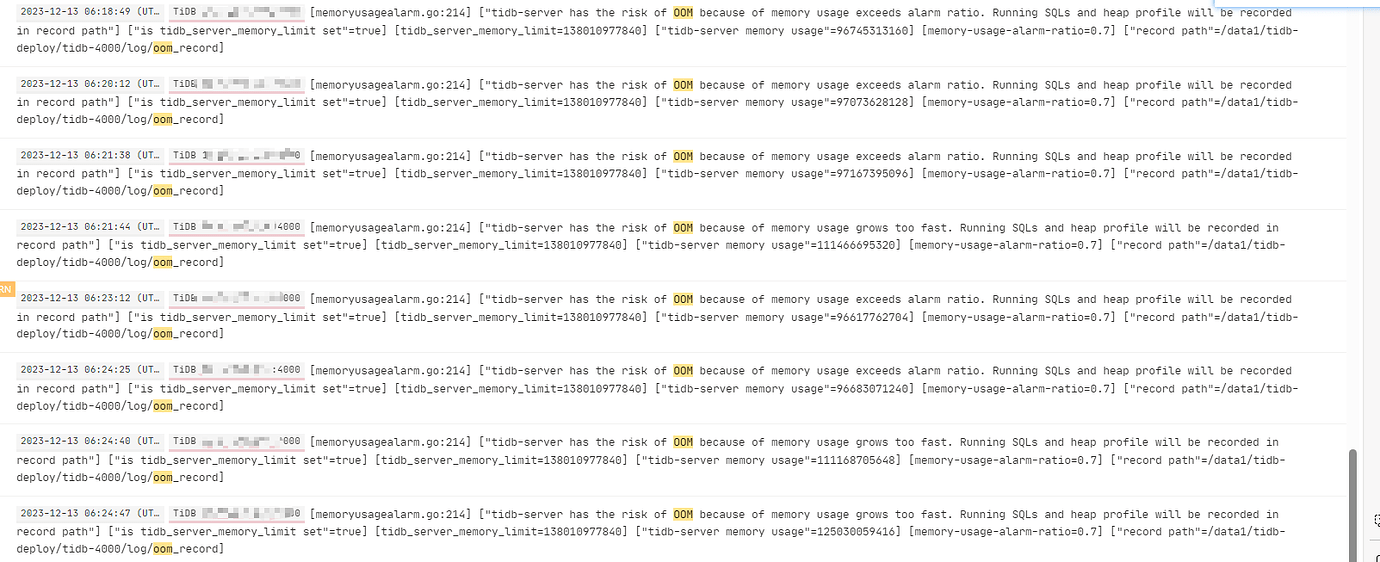
[Attachments: Screenshots/Logs/Monitoring] During the corresponding time and on the corresponding node, no OOM situation was found.
Reducing to 0 doesn’t mean the memory suddenly becomes 0; it means the data collection has stopped. The inability to collect data might be due to resource exhaustion, such as CPU or memory being fully utilized. Additionally, your TiDB is consuming a lot of memory. It is recommended to optimize your SQL queries. Also, setting tidb_mem_quota_query to 40G is excessive and may not be beneficial.
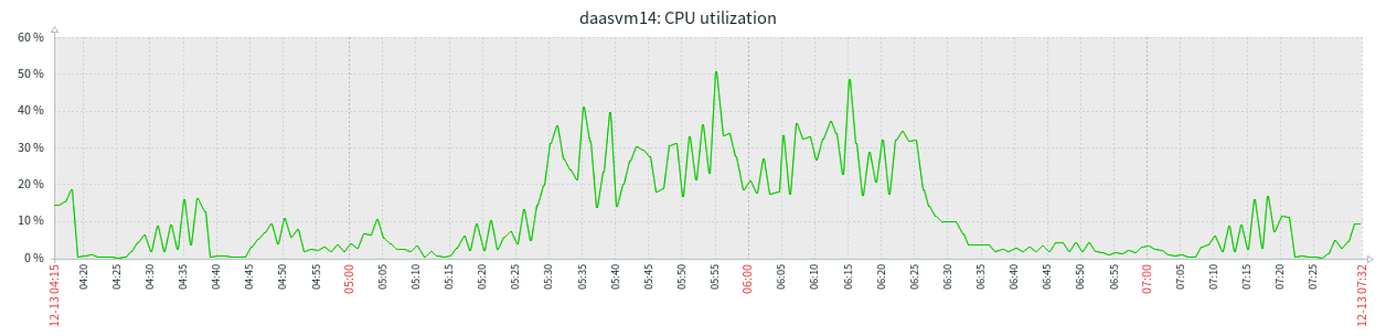
Monitoring CPU resource usage
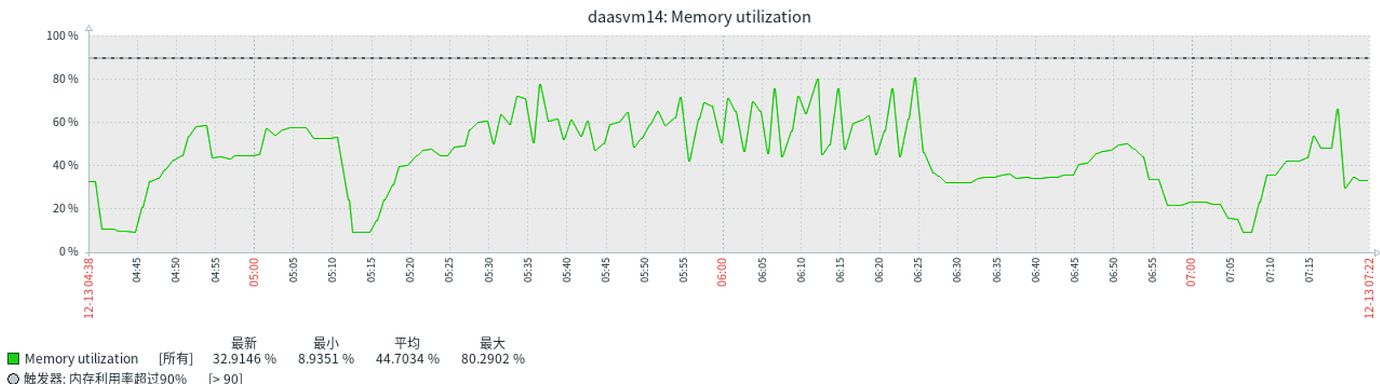
Memory usage
Memory & CPU resources are not exhausted, so why does this situation still occur?
The load is still too high.
These graphs look a bit strange. For example, the TiDB Uptime panel: if the tidb-server node really crashed and restarted, the Uptime curve should gradually rise after dropping to 0. However, the actual curve is consistent with the value before the drop, indicating that the tidb-server did not experience a crash and restart issue.
Considering that the large memory usage curve has similar issues, it can be concluded that the problem lies in the monitoring data collection component. Either the collection is intermittent, or there is a discontinuity in the display of the charts.
Therefore, you can investigate:
- Whether the monitoring collection components are functioning properly, such as checking if node_exporter, black_exporter, prometheus, etc., have restarted or are stuck.
- Investigate the Grafana display module to confirm whether the monitoring metric data collection is normal but the display has issues.
Confirm whether the cluster has been affected, such as whether there has been a sudden drop or severe fluctuation in the overall latency and QPS of business access to the TiDB cluster.
It looks like TiDB OOM caused a restart.
Bro, how did you determine that?
I think the possibility mentioned by the moderator above is more likely, and the possibility of OOM is relatively small.
Your machine is not functioning properly, one of the TiKV CPUs is maxed out.
If the process is OOM and killed by the operating system, then the uptime monitoring should start from 0, so it should not be a process OOM.
Check the system logs and search for “oom kill” and similar terms. Generally, if TiDB has an OOM (Out of Memory) event, there will be a “welcome ****” message indicating that the TiDB node has restarted.
Although this is the default configuration for TiDB, I personally think this setting is too high. For example, Oracle’s default configuration is 40% of physical memory, and it is generally recommended not to exceed 70%. This is because the operating system itself also requires a considerable amount of memory, and these limits often cannot be strictly enforced. In some scenarios where resources are tight, it may exceed 80%.
For instance, the official documentation mentions that the current tidb_server_memory_limit does not terminate the following SQL operations:
- DDL operations
- SQL operations containing window functions and common table expressions
Warning
- TiDB does not guarantee that the
tidb_server_memory_limit limit will take effect during startup. If the operating system has insufficient free memory, TiDB may still encounter OOM. You need to ensure that the TiDB instance has enough available memory.
- During memory control, the overall memory usage of TiDB may slightly exceed the
tidb_server_memory_limit.
Reference:
TiDB OOM Troubleshooting | PingCAP Documentation Center
Column - Exploration of TiDB Server OOM Issue Optimization | TiDB Community
It looks like the memory is exhausted or the network traffic is full, and even the monitoring cannot collect data. However, looking at your memory monitoring graph, the memory should not be full. Please confirm the network issue again…
His TiKV CPU is at 100%, so any monitoring is likely to be stuck.
It feels like the memory is growing too fast and is being limited by a certain parameter.