Note:
This topic has been translated from a Chinese forum by GPT and might contain errors.Original topic: 用tidb 预测股票的涨跌。
This prediction scheme was previously done by Alibaba Cloud, with TiDB only used for storage. The subsequent update to version 8.1 includes vector functions in TiDB. It is estimated that various machine learning functions will be supported soon, which will enable the functionality described by the author of this article.
Monthly Prediction
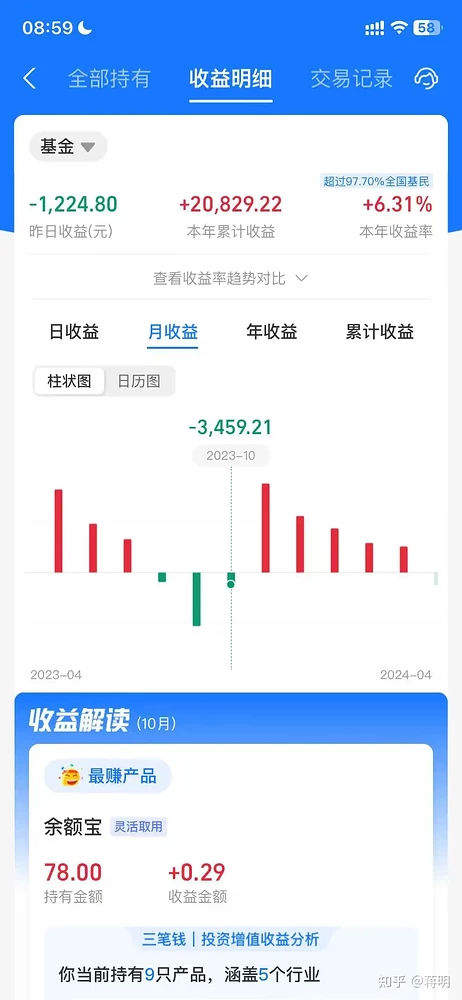
Monthly Revenue Calculation: There are always 3 months where the revenue turns negative.
Annual Prediction
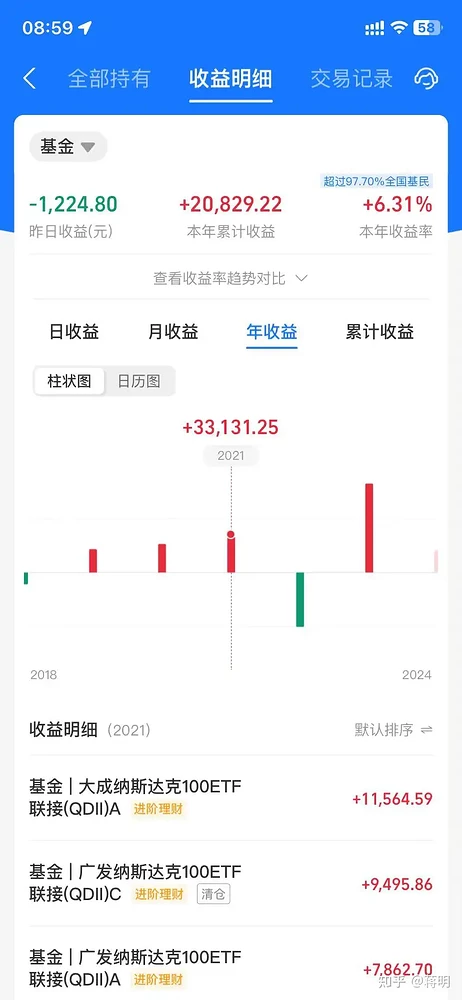
Annual Revenue Calculation: There is always 1 year where the revenue turns negative.
Using a machine learning function
source: bill | select date_format(res.stamp, ‘%Y-%m-%d’) as time, res.real as “Actual Consumption”, case when is_nan(res.real) then res.pred else null end as “Predicted Consumption”, res.instances from ( select sls_inner_ts_regression( cast(day as bigint), total, array [‘total’], 86400, 60 ) as res from ( select * from ( select *, max(day) over() as lastday from ( select to_unixtime(date_trunc(‘day’, time)) as day, sum(PretaxAmount) as total from ( select RecordID, arbitrary(time) as time, arbitrary(ProductCode) as ProductCode, arbitrary(item) as item, arbitrary(PretaxAmount) as PretaxAmount from log group by RecordID ) group by day order by day ) ) where day < lastday ) ) limit 1000
Using time series prediction to forecast
*and table: psin | select ts_regression_predict(stamp, value, 200, ‘linear’, 1, ‘avg’) from ( select stamp, value from log order by stamp limit 10000 )
Subsequent code updates.
The organized idea is to configure scheduled tasks to store daily stock prices in TiDB. Add a new day’s stock price every day.
Configure simulated position prices and calculate the daily returns of the stock. Fill in the historical returns. Use daily returns to calculate monthly and annual returns.
Since stock returns fluctuate and form an arc shape, you can use billing prediction functions or trend cycle predictions. This involves several pieces of code for entering stock data.
Step 1: Enter stock prices into the database
import yfinance as yf
import pymysql
from datetime import datetime, timedeltaDefine database connection parameters
db_params = {
‘host’: ‘’,
‘user’: ‘username’,
‘password’: ‘pass1word’,
‘db’: ‘test’
}Connect to the MySQL database
connection = pymysql.connect(**db_params)
cursor = connection.cursor()Create a new table for NASDAQ 100 data
create_table_query = “”"
CREATE TABLE IF NOT EXISTS nasdaq_100ss (
s text,
date DATE,
open FLOAT,
high FLOAT,
low FLOAT,
close FLOAT,
adj_close FLOAT,
volume BIGINT
)
“”"
cursor.execute(create_table_query)nasdaq_top_100 = # Please complete the list
import requests
from bs4 import BeautifulSoupSet request headers
headers = {
“user-agent”: “Mozilla/5.0 (Windows NT 10.0; Win64; x64) AppleWebKit/537.36 (KHTML, like Gecko) Chrome/92.0.4515.107 Safari/537.36”
}Send GET request
res = requests.get("https://api.nasdaq.com/api/quote/list-type/nasdaq100", headers=headers)
Parse JSON data
main_data = res.json()[‘data’][‘data’][‘rows’]
Print company names
for i in range(len(main_data)):
print(main_data[i][‘symbol’])
nasdaq_top_100.append(main_data[i][‘symbol’])for ticker_symbol in nasdaq_top_100:
Get stock data
Calculate the date 10 years ago from today
ten_years_ago = datetime.now() - timedelta(days=3650)
Fetch the historical data from yfinance
data = yf.download(ticker_symbol, start=ten_years_ago.strftime(‘%Y-%m-%d’))
Insert the data into the MySQL table
insert_query = “”"
INSERT INTO nasdaq_100ss (s,date, open, high, low, close, adj_close, volume)
VALUES (%s,%s, %s, %s, %s, %s, %s, %s)
“”"
for date, row in data.iterrows():
cursor.execute(insert_query, (ticker_symbol,date.date(), row[‘Open’], row[‘High’], row[‘Low’], row[‘Close’], row[‘Adj Close’], row[‘Volume’]))connection.commit()
Commit changes and close the connection
cursor.close()
connection.close()
Step 2: Call TiDB’s stored procedure
Generate daily returns using ETL stored procedures daily
Can be manually entered or done with code
Step 3: Aggregate daily data to generate monthly data
The basis for monthly calculation is that one hour is 3600 seconds
One day is 24 hours, one month is calculated as 30 days, 36002430
(* and s: GOOG) | select stamp, UV-lag(UV, 1, 0) over() as v from ( select FROM_UNIXTIME(date - date % 2592000) as stamp, avg(close) as UV from log GROUP BY stamp order by stamp limit 100000) order by stamp
Step 3: Aggregate daily data to generate annual data
One day is 24 hours, one year is calculated as 365 days, 360024365
(* and s: GOOG) | select stamp, UV-lag(UV, 1, 0) over() as v from ( select FROM_UNIXTIME(date - date % 31536000) as stamp, avg(close) as UV from log GROUP BY stamp order by stamp limit 100000) order by stamp
Step 4: Make predictions
*and table: psin | select ts_regression_predict(stamp, value, 200, ‘linear’, 1, ‘avg’) from ( select stamp, value from log order by stamp limit 10000 )
source: bill | select date_format(res.stamp, ‘%Y-%m-%d’) as time, res.real as “Actual Consumption”, case when is_nan(res.real) then res.pred else null end as “Predicted Consumption”, res.instances from ( select sls_inner_ts_regression( cast(day as bigint), total, array [‘total’], 86400, 60 ) as res from ( select * from ( select *, max(day) over() as lastday from ( select to_unixtime(date_trunc(‘day’, time)) as day, sum(PretaxAmount) as total from ( select RecordID, arbitrary(time) as time, arbitrary(ProductCode) as ProductCode, arbitrary(item) as item, arbitrary(PretaxAmount) as PretaxAmount from log group by RecordID ) group by day order by day ) ) where day < lastday ) ) limit 1000
The real code is as follows
- and s: MSFT | select ts_regression_predict(stamp, value, 200, ‘linear’, 1, ‘avg’) from (select stamp, UV-lag(UV, 1, 0) over() as value from (select (date - date % 2592000) as stamp, avg(close) as UV from log GROUP BY stamp order by stamp limit 100000) order by stamp)
This is to predict the rise and fall of Microsoft’s stock. The real rise and fall of Microsoft’s stock and the predicted values are shown. Blue is real, red is predicted. It’s quite accurate.
Moreover, you can see that the overall trend of the stock is upward, which means it is always profitable.
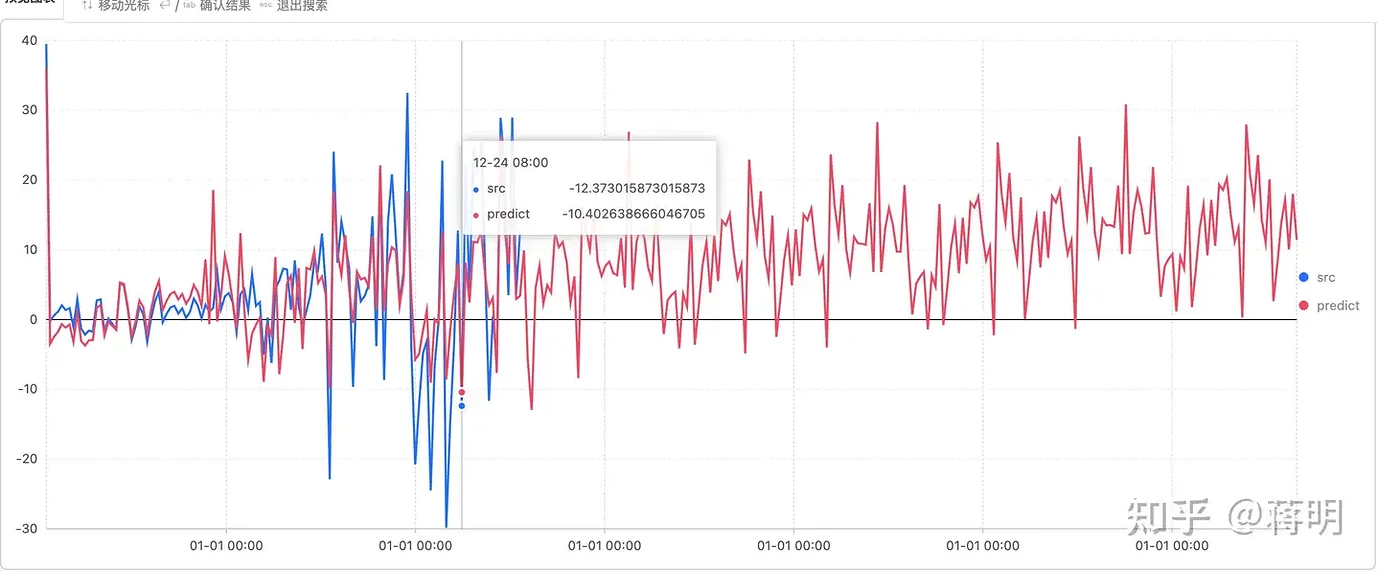
The reason is that history repeats itself. It is always a repetition of history.
Predict the rise and fall of the year and month. Buy more when it falls and sell when it rises.
The reason is that history repeats itself. It is always a repetition of history.
Predict the rise and fall of the year and month. Buy more when it falls and sell when it rises.