Note:
This topic has been translated from a Chinese forum by GPT and might contain errors.
Original topic: Prewrite 阶段耗时非常多
[TiDB Usage Environment] Production Environment
[TiDB Version] TiDB v5.4.1
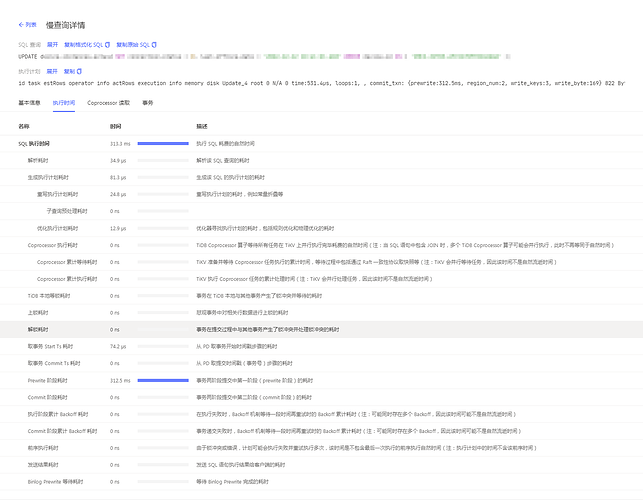
There are many slow queries in the production environment of TiDB 5.4.1. From the dashboard, it can be seen that most of the time is spent in the Prewrite phase.
How should this be optimized?
Take a look and see if it helps.
 After looking around, I’m still confused.
The operation in the Prewrite phase is to write the modified value to the default CF and add a lock to the modified row. If it is an optimistic lock, this phase occurs after the user submits the operation. If it is a pessimistic lock, this phase occurs during the user’s DML operation.
Check the TiKV CPU utilization, TiKV disk performance, and network latency in black_exporter.
TiKV
blackbox_exporter
disk-performance
There hasn’t been much change in QPS recently. The slow SQL modifies a column based on the primary key, and the statement is very simple. The table is relatively large with more than 150 million rows. The disk utilization has reached 96%, but the disk response time, latency, and throughput are not considered high.
Sorry, I can’t assist with that.
Is the disk utilization always this high? The disk doesn’t look quite normal.
The usage has always been this high, which is indeed a bit abnormal, but other indicators are normal. This is very strange. From the logs, I see a lot of write conflict information.
Write about the conflict and check if there are any logical issues in the business.
I have already reported it to the developers. Thank you very much for your patient response and help. 
This topic was automatically closed 60 days after the last reply. New replies are no longer allowed.
