Note:
This topic has been translated from a Chinese forum by GPT and might contain errors.
Original topic: 慢查询中prewrite占用时间巨大
[TiDB Usage Environment] Production Environment
[TiDB Version] V5.2.1
[Reproduction Path] What operations were performed when the issue occurred
[Encountered Issue: Problem Phenomenon and Impact]
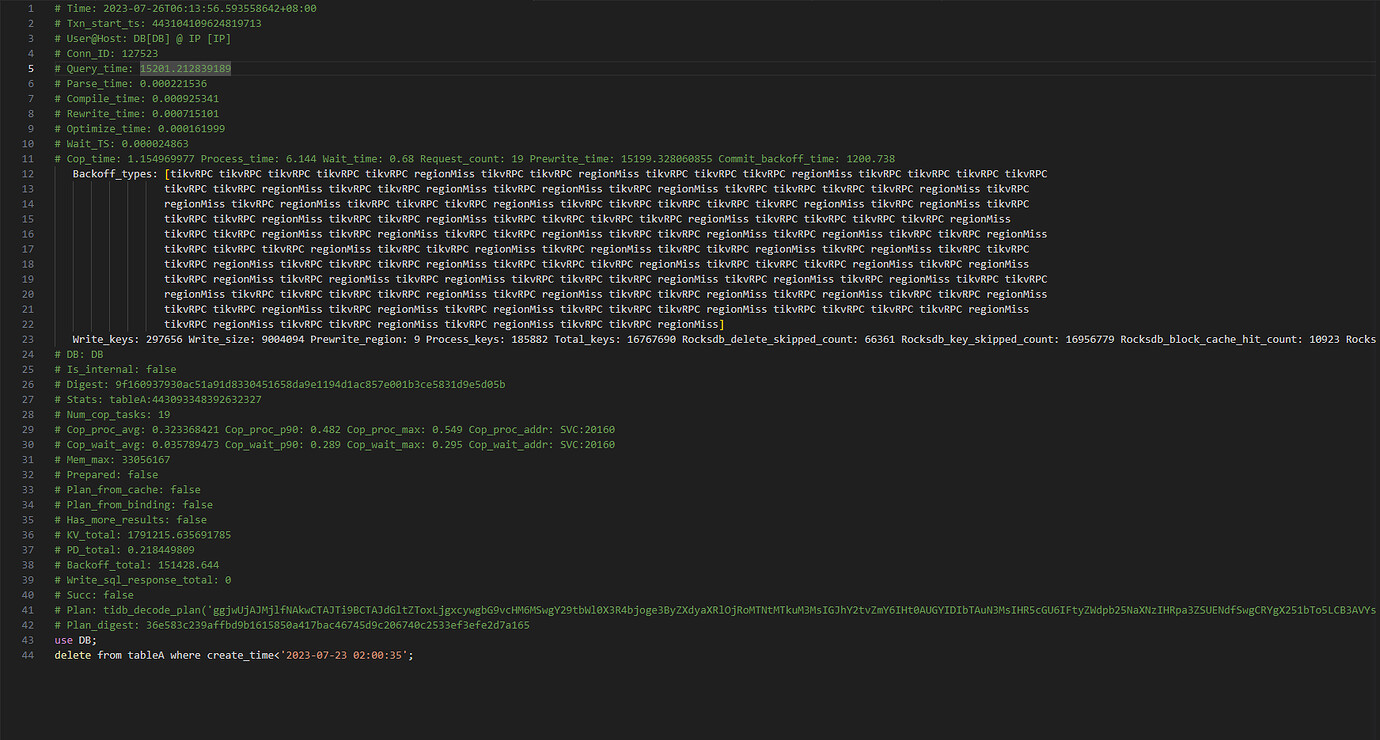
There is a scheduled task at 2 AM every day to delete data from the table, but it has been failing for the past two days. I checked the slow log, and this delete operation took more than 4 hours. Most of the time was spent on prewrite. Since this table has a scheduled insert operation approximately every 10 seconds, I initially thought this was the cause. However, even after stopping the insert operation, the issue persisted. I’m confused and would like to ask what might be causing this problem?
[Resource Configuration]
[Attachments: Screenshots/Logs/Monitoring]
Slow log: To fit it into one screenshot, I deleted about 40 lines of Backoff_types because they were too many and repetitive.
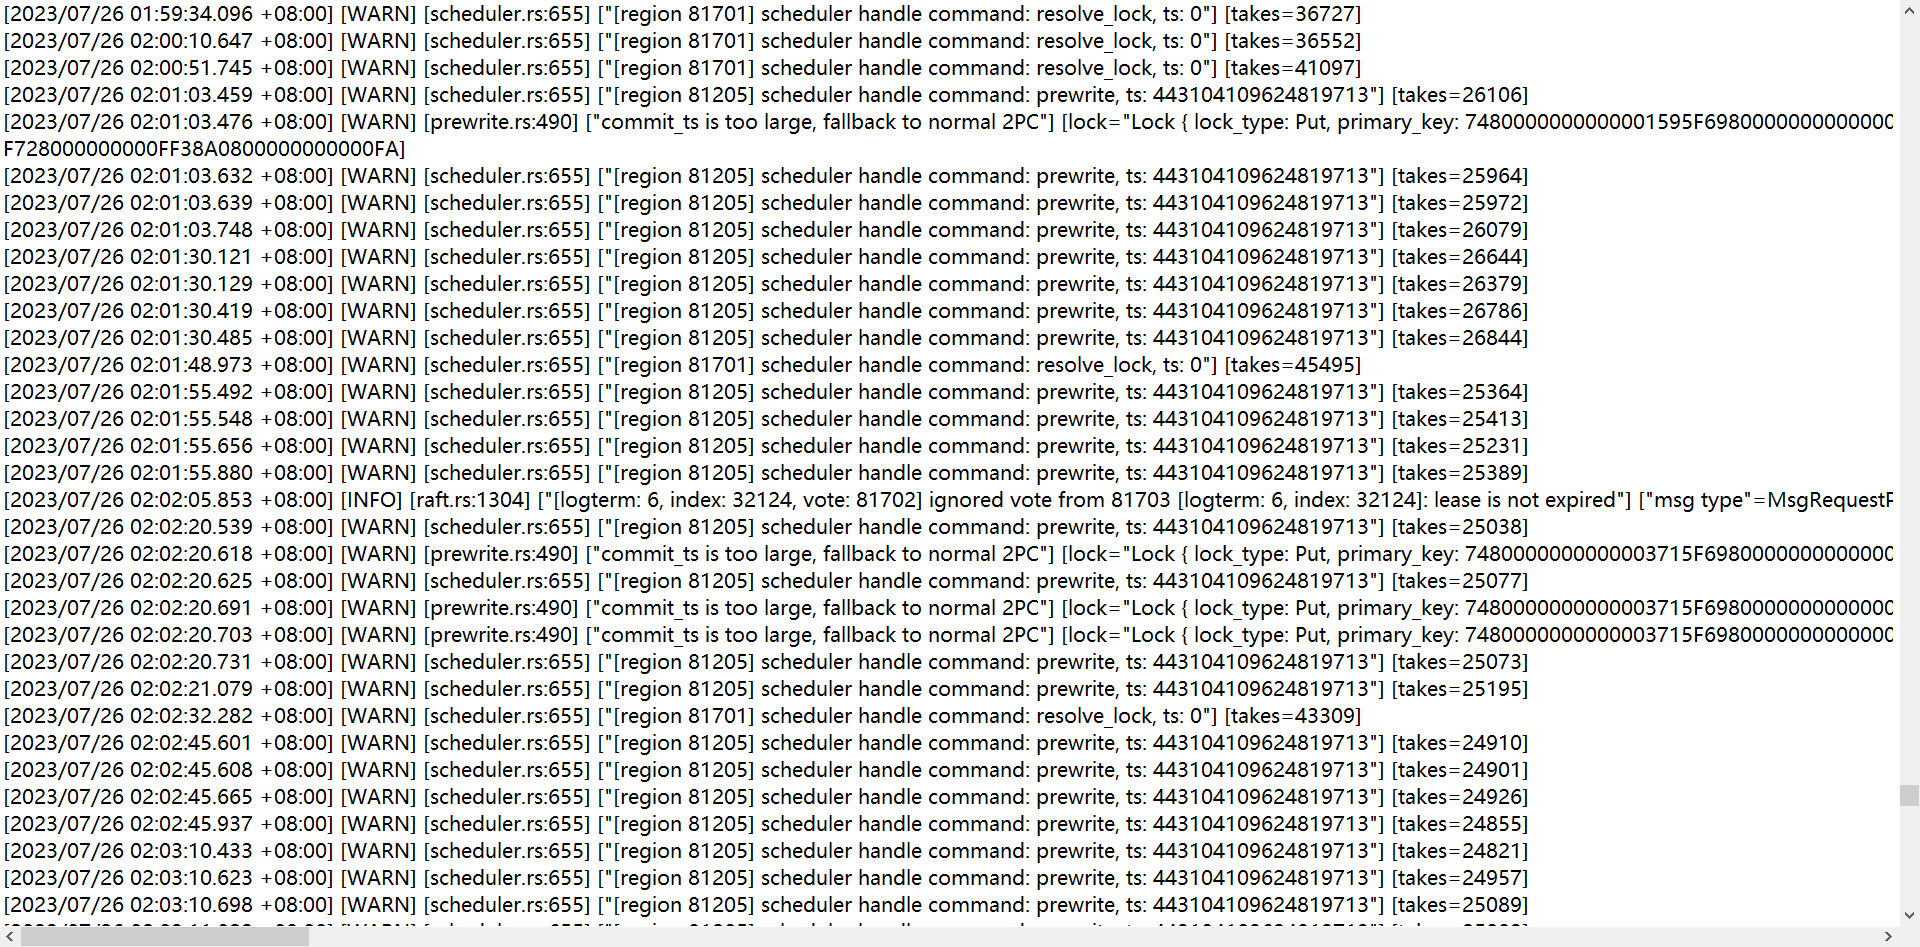
TiKV related logs
Slow log
Don’t delete data like this. When a single transaction is too large, prewrite will definitely be slow. Refer to some suggestions from the official documentation.
Delete Data | PingCAP Documentation Center
Are you using the pessimistic transaction model or the optimistic transaction model? Additionally, I suggest deleting data in a loop with a limit of 10,000.
Is the amount of deleted data relatively large?
Take a look at the overview during that time, the leader monitoring of TiKV, and the network latency of blackexporter.
The default pessimistic transaction model is scheduled to be deleted daily. It has been deleted for more than a year, and there were no issues before.
Previously, about 30,000 rows of data were deleted, but the recent failures should involve even more than that.
The expression delta(tikv_raftstore_region_count{type=“leader”}[30s]) < -10 has no data.
I don’t seem to have found blackexporter.
Take a look at the logs for this redlined TiKV. Was it restarted around 2:00?
There has been no restart.
According to this, export the monitoring data for one hour before and after 2 o’clock: including overview, tidb, and tikv-detail. Make sure to expand all the panels and wait for the data to load completely before exporting, otherwise there will be no data.
https://metricstool.pingcap.net/#backup-with-dev-tools
Uh, this environment only has one Prometheus available, no Grafana, and it can’t be deployed…
Restored to normal after rebuilding the table.
This topic was automatically closed 60 days after the last reply. New replies are no longer allowed.