Note:
This topic has been translated from a Chinese forum by GPT and might contain errors.
Original topic: Prometheus
[TiDB Usage Environment] Production Environment
[TiDB Version] 5.2.4
[Encountered Problem: Phenomenon and Impact]
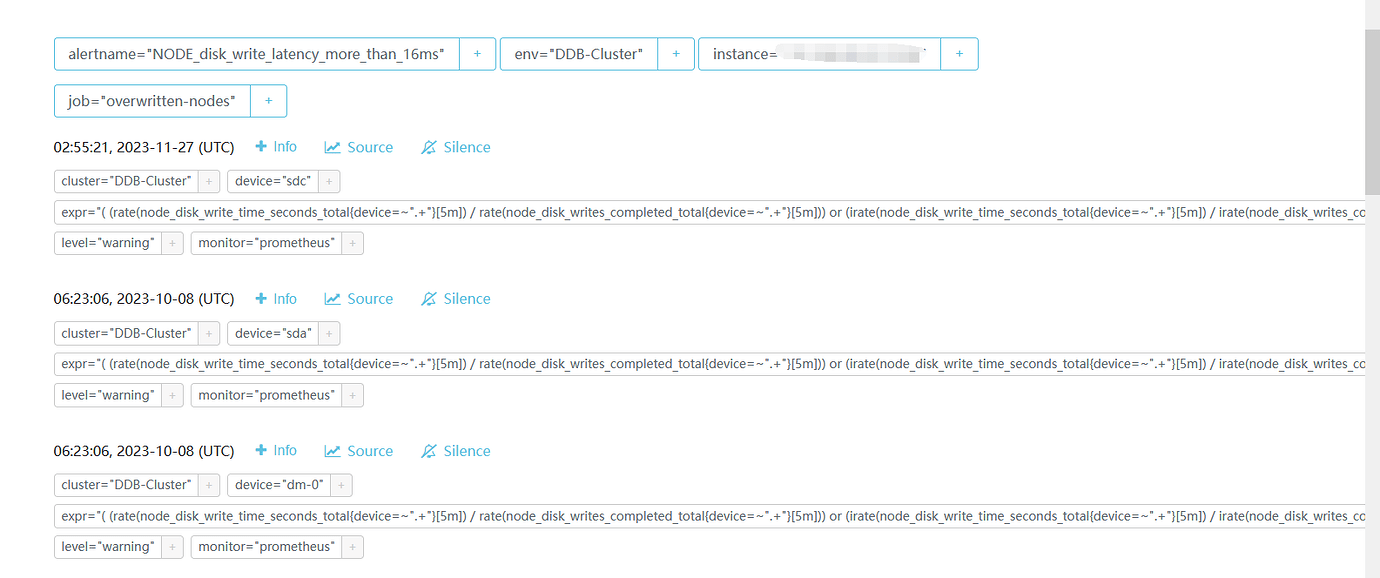
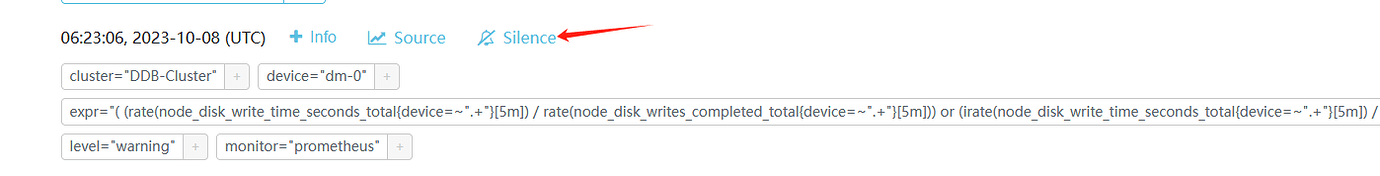
In the Dashboard, there are many alerts with alertname=“NODE_disk_write_latency_more_than_16ms” indicating disk latency warnings. These disks are mechanical disks for TiDB PD. Such alerts can be silenced and ignored, right? It’s quite annoying.
It is not recommended to ignore this. The PD’s disk operation is to refresh the transaction ID. If the disk operation is slow, the speed of allocating transaction IDs to compute nodes will be slow, which in turn will slow down the transaction response time. Therefore, it is recommended to use an SSD for PD.
For the testing environment, you can ignore it directly. For the production environment, it is recommended to increase the configuration and follow the official recommended configuration.
When there are about 10 alarms, the system disk on the TiKV node and the dm-0 alarm, this is not the deployment path of the TiKV node.
I have ignored it. Warning-level alerts are too frequent and can be ignored.
Where do you enable Alertmanager settings? I haven’t figured it out.
Okay, I’ll try turning off these warnings first and see.
TiDB and PD are SAS. Later, I will apply to the leadership to replace the drive letter of PD.
http://alertmanager server IP:9093/#/alerts
You can filter it out first, but if it’s in production, you need to face it seriously, indicating that IO has already encountered a bottleneck.
This topic was automatically closed 60 days after the last reply. New replies are no longer allowed.