Note:
This topic has been translated from a Chinese forum by GPT and might contain errors.Original topic: 游标方式查询数据,批量写入导致 tidb-server oom
[TiDB Usage Environment] Production Environment
[TiDB Version] V7.1.0
[Reproduction Path]
Transaction Logic
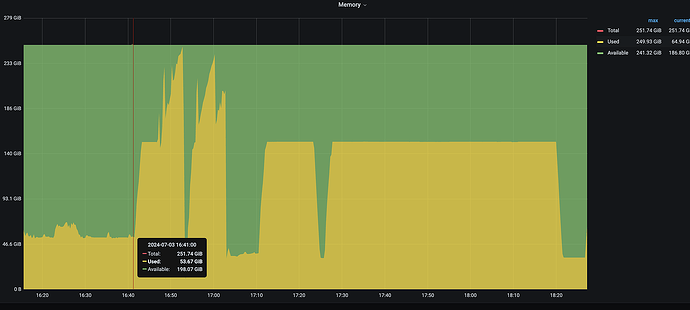
- Long cursor connection “scanning the entire table” approximately 2 billion rows of data
- ETL writes to TiDB in batches of 1000 rows
- Start 8 processes to write, triggering OOM
- First adjustment: changed to 4 concurrent processes, memory usage 65%, no OOM occurred.
- Second adjustment: changed to 3 concurrent processes, memory usage 65%, no OOM occurred [same memory usage as the first adjustment].
- Third adjustment: changed to 4 processes, and changed the cursor query from “full table scan” to “index range query – half-year query”, memory usage 25%.
[Encountered Issues: Problem Phenomenon and Impact]
- In the above step 3, OOM was triggered. Why didn’t the cursor query release memory in time?
- Why did changing the cursor query from “full table scan” to “index range query” significantly reduce memory usage (should be the same root cause as the first problem, personally understand it as memory not being released in time, or there is a bug).
Profile and heap were captured, but couldn’t be opened as recommended by the official documentation.
Appendix: 开发 Java 应用使用 TiDB 的最佳实践 | PingCAP 文档中心
