Note:
This topic has been translated from a Chinese forum by GPT and might contain errors.Original topic: TopN 算子中的actrows 疑问
The version is 6.5.3
Data source is tpch
SQL statement:
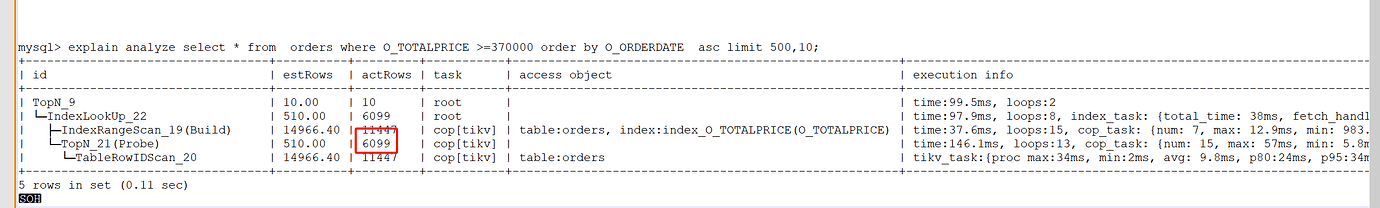
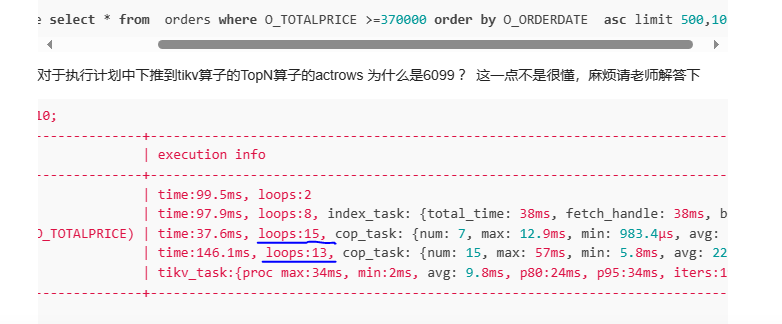
explain analyze select * from orders where O_TOTALPRICE >=370000 order by O_ORDERDATE asc limit 500,10;
Why is the actrows of the TopN operator pushed down to tikv in the execution plan 6099? I don’t quite understand this point, please explain it.
mysql> explain analyze select * from  orders where O_TOTALPRICE >=370000 order by O_ORDERDATE  asc limit 500,10;
+----------------------------------+----------+---------+-----------+------------------------------------------------------+--------------------------------------------------------------------------------------------------------------------------------------------------------------------------------------------------------------------------------------------------------------------------------------------------------------------------------------------------------------------------------------------------------------------------------------------------------------------------------------------------------------------------------------------+------------------------------------------------+----------+------+
| id                               | estRows  | actRows | task      | access object                                        | execution info                                                                                                                                                                                                                                                                                                                                                                                                                                                                                                                             | operator info                                  | memory   | disk |
+----------------------------------+----------+---------+-----------+------------------------------------------------------+--------------------------------------------------------------------------------------------------------------------------------------------------------------------------------------------------------------------------------------------------------------------------------------------------------------------------------------------------------------------------------------------------------------------------------------------------------------------------------------------------------------------------------------------+------------------------------------------------+----------+------+
| TopN_9                           | 10.00    | 10      | root      |                                                      | time:99.5ms, loops:2                                                                                                                                                                                                                                                                                                                                                                                                                                                                                                                       | tpch2.orders.o_orderdate, offset:500, count:10 | 307.6 KB | N/A  |
| └─IndexLookUp_22                 | 510.00   | 6099    | root      |                                                      | time:97.9ms, loops:8, index_task: {total_time: 38ms, fetch_handle: 38ms, build: 6.63µs, wait: 6.81µs}, table_task: {total_time: 151.3ms, num: 5, concurrency: 5}, next: {wait_index: 3.64ms, wait_table_lookup_build: 231.9µs, wait_table_lookup_resp: 92.3ms}                                                                                                                                                                                                                                                                             |                                                | 1.31 MB  | N/A  |
|   ├─IndexRangeScan_19(Build)     | 14966.40 | 11447   | cop[tikv] | table:orders, index:index_O_TOTALPRICE(O_TOTALPRICE) | time:37.6ms, loops:15, cop_task: {num: 7, max: 12.9ms, min: 983.4µs, avg: 5.69ms, p95: 12.9ms, max_proc_keys: 4695, p95_proc_keys: 4695, tot_proc: 2ms, tot_wait: 4ms, rpc_num: 7, rpc_time: 39.6ms, copr_cache: disabled, distsql_concurrency: 15}, tikv_task:{proc max:2ms, min:0s, avg: 714.3µs, p80:1ms, p95:2ms, iters:35, tasks:7}, scan_detail: {total_process_keys: 11447, total_process_keys_size: 526562, total_keys: 11454, get_snapshot_time: 2.47ms, rocksdb: {key_skipped_count: 11447, block: {cache_hit_count: 56}}}       | range:[370000.00,+inf], keep order:false       | N/A      | N/A  |
|   └─TopN_21(Probe)               | 510.00   | 6099    | cop[tikv] |                                                      | time:146.1ms, loops:13, cop_task: {num: 15, max: 57ms, min: 5.8ms, avg: 22.7ms, p95: 57ms, max_proc_keys: 1967, p95_proc_keys: 1967, tot_proc: 150ms, tot_wait: 19ms, rpc_num: 15, rpc_time: 340.6ms, copr_cache: disabled, distsql_concurrency: 15}, tikv_task:{proc max:36ms, min:2ms, avg: 10.5ms, p80:25ms, p95:36ms, iters:19, tasks:15}, scan_detail: {total_process_keys: 11447, total_process_keys_size: 1732802, total_keys: 11463, get_snapshot_time: 7.62ms, rocksdb: {key_skipped_count: 32, block: {cache_hit_count: 42082}}} | tpch2.orders.o_orderdate, offset:0, count:510  | N/A      | N/A  |
|     └─TableRowIDScan_20          | 14966.40 | 11447   | cop[tikv] | table:orders                                         | tikv_task:{proc max:34ms, min:2ms, avg: 9.8ms, p80:24ms, p95:34ms, iters:19, tasks:15}                                                                                                                                                                                                                                                                                                                                                                                                                                                     | keep order:false                               | N/A      | N/A  |
+----------------------------------+----------+---------+-----------+------------------------------------------------------+--------------------------------------------------------------------------------------------------------------------------------------------------------------------------------------------------------------------------------------------------------------------------------------------------------------------------------------------------------------------------------------------------------------------------------------------------------------------------------------------------------------------------------------------+------------------------------------------------+----------+------+
5 rows in set (0.11 sec)
Table structure
mysql> show create table orders;
+--------+-------------------------------------------------------------------------------------------------------------------------------------------------------------------------------------------------------------------------------------------------------------------------------------------------------------------------------------------------------------------------------------------------------------------------------------------------------------------------------------------------------------------------------------------------------------------------------------------------------------------------------------------------------------------+
| Table  | Create Table                                                                                                                                                                                                                                                                                                                                                                                                                                                                                                                                                                                                                                                      |
+--------+-------------------------------------------------------------------------------------------------------------------------------------------------------------------------------------------------------------------------------------------------------------------------------------------------------------------------------------------------------------------------------------------------------------------------------------------------------------------------------------------------------------------------------------------------------------------------------------------------------------------------------------------------------------------+
| orders | CREATE TABLE `orders` (
  `O_ORDERKEY` bigint(20) NOT NULL,
  `O_CUSTKEY` bigint(20) NOT NULL,
  `O_ORDERSTATUS` char(1) NOT NULL,
  `O_TOTALPRICE` decimal(15,2) NOT NULL,
  `O_ORDERDATE` date NOT NULL,
  `O_ORDERPRIORITY` char(15) NOT NULL,
  `O_CLERK` char(15) NOT NULL,
  `O_SHIPPRIORITY` bigint(20) NOT NULL,
  `O_COMMENT` varchar(79) NOT NULL,
  PRIMARY KEY (`O_ORDERKEY`) /*T![clustered_index] CLUSTERED */,
  KEY `index_O_TOTALPRICE` (`O_TOTALPRICE`),
  KEY `index_a` (`O_ORDERSTATUS`,`O_TOTALPRICE`),
  KEY `indexO_CUSTKEY` (`O_CUSTKEY`),
  KEY `index_date` (`O_ORDERDATE`)
) ENGINE=InnoDB DEFAULT CHARSET=utf8mb4 COLLATE=utf8mb4_bin |
+--------+-------------------------------------------------------------------------------------------------------------------------------------------------------------------------------------------------------------------------------------------------------------------------------------------------------------------------------------------------------------------------------------------------------------------------------------------------------------------------------------------------------------------------------------------------------------------------------------------------------------------------------------------------------------------+
1 row in set (0.00 sec)