Questions about the ORDER BY LIMIT in TiDB execution plans

Note:
This topic has been translated from a Chinese forum by GPT and might contain errors.

Original topic: tidb 执行计划的order by limit 疑问

| username: Raymond

Version v5.3.3
I have a question.
After importing table data into TiDB using sysbench, I performed the following query on the sbtest1 table: select c from sbtest1 where k>1 order by id limit 2;
Table structure


Execution plan

mysql> explain analyze select c from sbtest1 where k>1 order by id limit 2;
+--------------------------------+---------+---------+-----------+---------------+-----------------------------------------------------------------------------------------------------------------------------------------------------------------------------------------------------------------------------------------------+-------------------------+-----------+------+
| id                             | estRows | actRows | task      | access object | execution info                                                                                                                                                                                                                                | operator info           | memory    | disk |
+--------------------------------+---------+---------+-----------+---------------+-----------------------------------------------------------------------------------------------------------------------------------------------------------------------------------------------------------------------------------------------+-------------------------+-----------+------+
| Projection_8                   | 2.00    | 2       | root      |               | time:1.87ms, loops:2, Concurrency:OFF                                                                                                                                                                                                         | sbtest.sbtest1.c        | 646 Bytes | N/A  |
| └─Limit_12                     | 2.00    | 2       | root      |               | time:1.87ms, loops:2                                                                                                                                                                                                                          | offset:0, count:2       | N/A       | N/A  |
|   └─TableReader_25             | 2.00    | 2       | root      |               | time:1.86ms, loops:1, cop_task: {num: 1, max: 1.81ms, proc_keys: 32, rpc_num: 1, rpc_time: 1.8ms, copr_cache_hit_ratio: 0.00}                                                                                                                 | data:Limit_24           | 2.10 KB   | N/A  |
|     └─Limit_24                 | 2.00    | 2       | cop[tikv] |               | tikv_task:{time:0s, loops:1}, scan_detail: {total_process_keys: 32, total_process_keys_size: 7168, total_keys: 80, rocksdb: {delete_skipped_count: 5, key_skipped_count: 84, block: {cache_hit_count: 2, read_count: 0, read_byte: 0 Bytes}}} | offset:0, count:2       | N/A       | N/A  |
|       └─Selection_23           | 2.00    | 32      | cop[tikv] |               | tikv_task:{time:0s, loops:1}                                                                                                                                                                                                                  | gt(sbtest.sbtest1.k, 1) | N/A       | N/A  |
|         └─TableFullScan_22     | 2.00    | 32      | cop[tikv] | table:sbtest1 | tikv_task:{time:0s, loops:1}                                                                                                                                                                                                                  | keep order:true         | N/A       | N/A  |
+--------------------------------+---------+---------+-----------+---------------+-----------------------------------------------------------------------------------------------------------------------------------------------------------------------------------------------------------------------------------------------+-------------------------+-----------+------+


Here, the reason for choosing a table full scan, I guess, is as follows:

  1. Because id is the primary key, during the full table scan, if k>1 is encountered, the value of the c field can be directly retrieved. At this time, id itself is already ordered, so as long as k>1 is encountered twice, this statement can be completed. In this case, the full table scan is not slow, but I think this is based on the assumption that k>1 can be found quickly in the full table scan.
    However, there may be a situation where it takes a long time to find values that satisfy k>1 in the full table scan. Does this mean that the full table scan is not the optimal solution in this case? At this time, using the index on the k field to search might be a better solution. I wonder if this guess is correct.
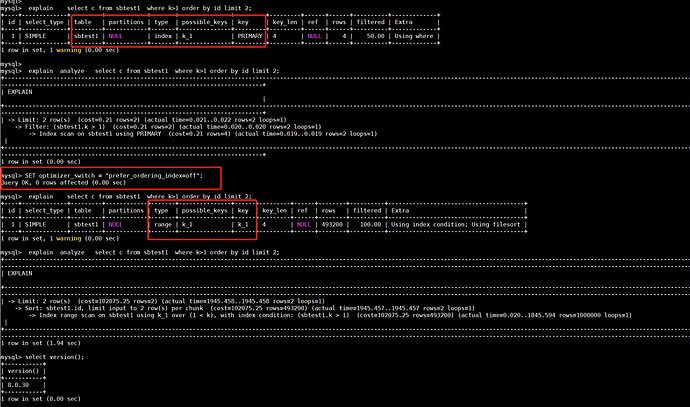
    Comparing MySQL’s execution plan, the default behavior of the MySQL optimizer is also similar to TiDB’s full table scan (directly scanning the entire primary key index), but by adjusting parameters, the optimizer can be made to choose the index on the k field.

  2. I don’t quite understand why the actRows in TiDB’s execution plan is 32. Could you please explain this?

| username: forever | Original post link

  1. There is no problem with the execution plan for the first full table; TiDB can add a hit to control the use of the index.
  2. The 32 here looks like a fixed operator output. When the limit is less than 32, astrows is 32; when the limit is greater than 32, it is a multiple of 32 (observed only with restrictions in order by). Specific source code analysis and related materials have not provided a detailed explanation.
| username: h5n1 | Original post link

  1. Check how many entries have k>1 and compare with the total.
  2. Use show table sbtest1 regions to see the number of regions.
| username: Raymond | Original post link

  1. I experimented myself, and it should be related to this reason. If a lot of data is scanned through the index, combined with the cost of table lookups, it is not as fast as a full table scan. Here, I would like to ask the teacher, how does the TiDB optimizer know that the cost of index scanning is higher? Which part of the statistical information is it based on?

| username: Raymond | Original post link

Thank you, teacher. It is indeed like this, but I don’t quite understand why it is designed this way. In theory, actrows should be the actual number of rows scanned, but here actrows is not the actual number of rows scanned?

| username: forever | Original post link

Actrows is the actual number of returned rows, currently, this has returned 32 rows to TiDB.

| username: h5n1 | Original post link

Do you see if the data returned by the SQL execution is the same each time? It feels a bit off. Trace the two SQLs separately and see if the region IDs are the same.

| username: Raymond | Original post link

Why does it actually return 32 rows?

| username: Raymond | Original post link

Trace

| username: h5n1 | Original post link

  1. One region will construct a cop task query request. Since there are 4 regions in the table, the trace will show 4.
  2. Because the SQL is sorted by ID and then limited, and the ID column happens to be the rowid column, although the trace shows 4 cop tasks for the full table scan, in reality, only 1 cop task is executed, and the others are terminated.
  3. Data is returned in chunks. 32 is likely the default initial size for each request. With each next call, the size doubles until it reaches max_chunk_size. When the limit is 32, only one request is needed to meet the requirement, resulting in actrows 32. When the limit is 33, two next requests are needed, returning 32+64=96 rows. If the limit is 97, it will become 224.
| username: 人如其名 | Original post link

Brother, this is how I understand it. For limit cases, there are two types:

  1. For simple statements like select * from A limit N, if the limit is pushed down and N >= 100,000, it uses tidb_distsql_scan_concurrency for concurrent cop_task requests. If N < 100,000, it executes cop_task requests serially until the limit operator meets the query condition and then terminates subsequent cop_task requests.

  2. For other complex cases, there are two types: one is keeporder=false, which uses tidb_distsql_scan_concurrency for concurrency, and the other is keeporder=true, which uses 2 for concurrency. Here, it uses the index, and with keeporder=true, it adopts the second case.
    The initial value of the first chunk, newFirstChunk, in the limit operator is min(limit offset + count, max_chunk_size default 1024 rows). So as long as it is limit N and N is less than 1024, the first data retrieval will be N records as requireRows. However, subsequently, it retrieves according to min(remaining records, max_chunk_size). Therefore, for limit 32 or 33, the limit operator should call newFirstChunk once during Open and Next once during Next, but no more data needs to be read (thus, in the execution information, you should see the limit operator loop twice and the table_reader operator loop once).
    When performing the open operation for each operator, newFirstChunk is called. If the number of records required by the operator is less than requiredRows in newFirstChunk during open, there is no need for parallelism, and a single cop_task completes it. If more records are needed, the aforementioned parallelism rules apply.

My understanding has some discrepancies with the observed phenomena, waiting for experts to help explain.

| username: 人如其名 | Original post link

Let me supplement the execution plan simulation of the same execution plan as the original poster with the explain analyze execution situation. limitN’s Next call behavior.txt (21.9 KB)

You can see that whether it’s limit32 or 33, the loop (next) behavior is the same. However, when it exceeds max_chunk_size, such as 1025, the loop increases by one. When set to 2049, the loop increases by one again. For cases where cop_task is greater than 3, you can see that a concurrency=2 parallel strategy is adopted (num*avg/2 in cop_task is approximately equal to time).

| username: Raymond | Original post link

  1. Because the SQL is sorted by ID and then limited, and the ID column happens to be the rowid column, although the full table scan trace shows 4 cop tasks, in reality, only 1 cop task is executed, and the others are terminated.
    Can you explain why, although there is indeed 1 cop task, only 1 cop task is executed, and the others are terminated? How should this be understood?
| username: 人如其名 | Original post link

From the original poster’s perspective, whether it’s limit 2 or limit 32, a full table scan on TiKV still requires scanning 32 rows of records. This doesn’t make sense… With the same data, limit 32 should definitely scan more.

| username: 人如其名 | Original post link

Because a single cop_task can fetch all the desired results, once the limit operator gets the required results, it stops fetching data, and the remaining cop_tasks are canceled. The total number of cop_tasks is based on a full table scan, and once the first one completes and meets the data extraction task, the subsequent extraction plans are terminated.

| username: Raymond | Original post link

Forever bro said it, I feel this explanation is more reasonable.

| username: 人如其名 | Original post link

I see, it turns out that the k>1 in the limit 2 part is different from the k>2 in the limit 32 part. The conditions are different. :innocent:

| username: Raymond | Original post link

k>1 limit 32 actRows is also 32

| username: 人如其名 | Original post link

Please provide the execution information for the conditions where the limit is 3, 1023, 1025, and 2049.

| username: Raymond | Original post link

3