Questions about TiKV instance memory usage?

Note:
This topic has been translated from a Chinese forum by GPT and might contain errors.

Original topic: 关于TiKV实例内存使用的疑问?

| username: OnTheRoad

[TiDB Usage Environment] Production Environment
[TiDB Version] 5.3.0
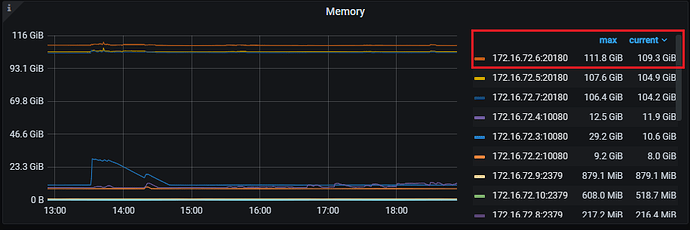
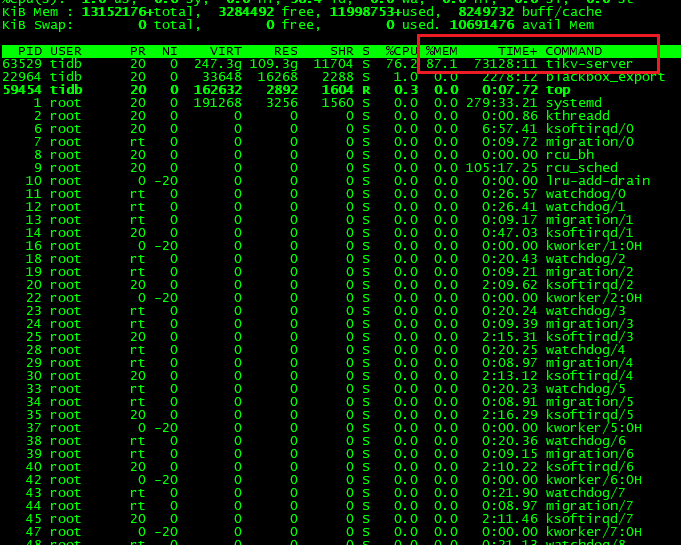
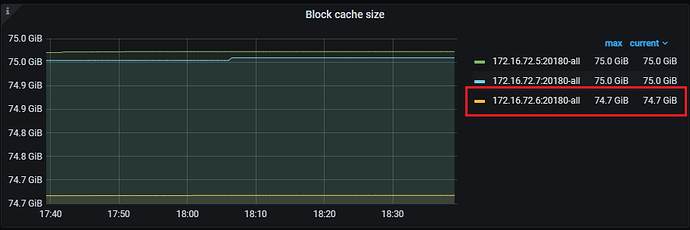
[Encountered Problem] The storage.block-cache.capacity parameter has been set to limit the Block Cache Size to 90G. However, the Grafana panel shows the Block Cache Size as 75G. The system’s top command shows that the TiKV-Server is using 111G of memory.

[Problem Phenomenon and Impact]

  1. Below is the TIKV configuration returned by tiup cluster edit-config <cluster_name>
  tikv:
    raftdb.defaultcf.block-cache-size: 4GiB
    readpool.unified.max-thread-count: 38
    rocksdb.defaultcf.block-cache-size: 50GiB
    rocksdb.lockcf.block-cache-size: 4GiB
    rocksdb.writecf.block-cache-size: 25GiB
    server.grpc-concurrency: 14
    server.grpc-raft-conn-num: 5
    split.qps-threshold: 2000
    storage.block-cache.capacity: 90GiB
  1. Below is the Grafana->TiKV-Detail->RocksDB-KV->Block Cache Size panel,

  2. Below is the Grafana->TiKV-Detail->Cluster->Memory panel, which is consistent with the system’s top display.

Questions

  1. Shouldn’t the value in the Grafana->TiKV-Detail->RocksDB-KV->Block Cache Size panel be 90G? Why is it 75G?
  2. The Grafana->TiKV-Detail->Cluster->Memory panel shows that TiKV is using a total of 111G of memory. Who is using the remaining 36G (i.e., 111-75)? Which panel can I check this on?
| username: xfworld | Original post link

Block Cache Size != tikv server memory. Block Cache Size refers only to the cache value, and the first figure describes the max value, but in reality, only about 75% is used.

For the second question, the actual values are equal.
The maximum tikv instance is 1118 GB, and the current is 109.3 GB.
Then, the top monitoring chart shows the current usage is 87.1%, and the total is 13152176. Multiplying these values matches the above value…

The remaining memory is left for the system, with some used for system cache, some reserved, and some in a free state.
Refer to the information described in top.

| username: xiaohetao | Original post link

Check the block cache hit rate configuration (parameter: block-cache.capacity)

| username: OnTheRoad | Original post link

This seems a bit off-topic, doesn’t it?

| username: jansu-dev | Original post link

  1. Question one: Currently, there doesn’t seem to be any issue. Has the cache capacity not increased until now?
  2. Question two: I understand that the main goal is to identify the components consuming memory, which are primarily raft, grpc, and other structures like struct, channel, and the runtime itself. You can look at the following two panels together:
    tikv-details --> server --> Memory trace
    tikv-details --> memory --> Allocator Stats
| username: OnTheRoad | Original post link

I confirmed the configuration. The 75G was set through the SET command. The 90G was set in the cluster topology configuration file. Based on the behavior, it seems that the value set by the SET command has a higher priority than the one in the cluster configuration file.

| username: jansu-dev | Original post link

set config? This is an online modification. Actually, there’s no priority between the two, but set config won’t change the persistent data of tiup, meaning: reloading the configuration will overwrite it. So the problem is solved, remember to mark it, thanks.”

| username: system | Original post link

This topic was automatically closed 60 days after the last reply. New replies are no longer allowed.